Clients receive 24/7 access to proven business and technology insights, expert guidance, benchmarks, diagnostics and more. Fill out the form to connect with a representative and learn more.
Or Send us an email
enquiry@daiom.in
By proceeding, you agree to the Daiom Terms of Services and Privacy Policy.
- Cash flow is critical; inventory ties up capital, impacting business sustainability.
- Fast fashion brands like Zara excel by prioritizing inventory velocity over sheer volume.
- Tracking inventory turns and days is essential for understanding cash efficiency and operational health.
There’s a saying in business that every founder eventually learns the hard way:
“Top line is vanity, bottom line is sanity, cash in the bank is reality.”
Most product businesses chase revenue first. Then they work on profitability. But even after cracking both — many still struggle with cash.
Why? Because cash gets stuck in assets.
And one of the biggest places it gets stuck is inventory.
Inventory is an asset on your balance sheet. But it’s also locked capital — money that has left your bank account and is now sitting on a shelf, in a warehouse, or in transit. Until it sells, it isn’t working for you. It locks capital and blocks your capital efficiency.
This is specifically true for brands delivering physical goods — retail, clothing, beauty, home. Not digital products.
The path is simple to state, hard to execute:
Profitability → Cash → Inventory managed well.
Getting profitable is the first goal. Generating strong cash from that profitability is the second. And you cannot generate strong cash if your inventory is constantly absorbing it.
1. The Core Problem — Cash vs. Profitability
Most brands track revenue. Many track margins. Very few track the gap between the two: how fast inventory converts into cash.
Here’s the tension that no P&L statement makes visible:
Profitability is an accounting outcome. Cash flow is a survival reality.
You pay for your inventory when you manufacture or procure it — not when you sell it. From that moment, your capital is locked.
Meanwhile, your expenses don’t stop:
Salaries
Rent
Marketing
Logistics
So even if your books look healthy, you can still feel constantly cash-strapped. That’s not a sales problem. It’s a velocity problem.
2. The Cycle Every Product Business Lives In
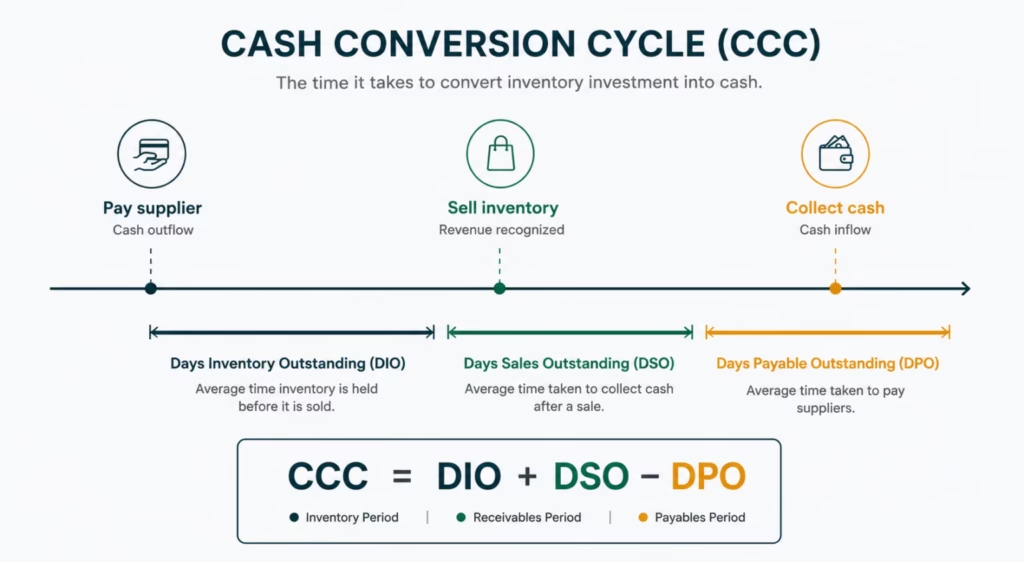
Every product business runs on one cycle:
Cash → Inventory → Sales → Cash
The question isn’t whether this cycle exists. It always does.
The question is: how long does each loop take?
A business turning inventory every 45 days is a fundamentally different machine from one turning it every 120 days — even if both show the same revenue on paper.
When inventory piles up, most brands reach for the easiest lever available: discounts. Clear the stock, recover cash, move on.
But done repeatedly, this creates a slow-motion trap:
Excess inventory → discounts
Discounts → lower margins
Lower margins → pressure to sell more volume
More volume → more inventory
It feels like a sales problem. It isn’t.
3. What Zara and H&M Show Us
No industry has figured out inventory velocity better than fast fashion. And no comparison makes it clearer than Zara vs. H&M.
Both brands operate in the same market — same customers, same trends. But their inventory approach is structurally different.
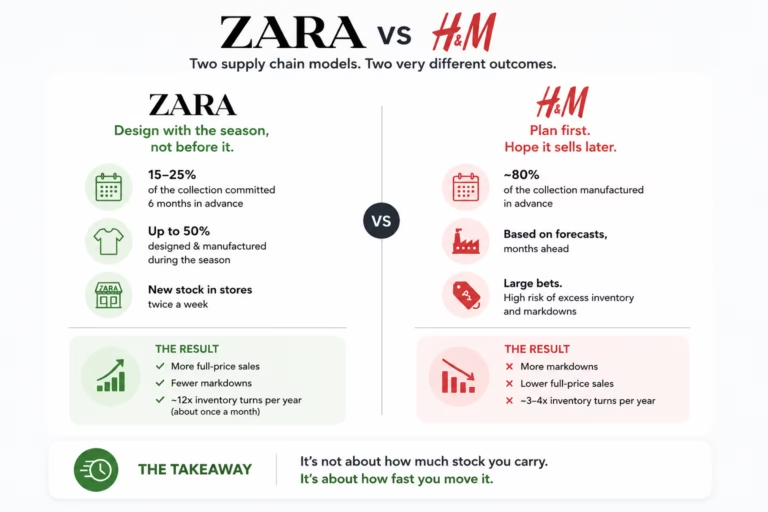
H&M manufactures about 80% of its retail inventory in advance, based on forecasts. Large bets are placed months before demand is confirmed. When a style underperforms, inventory accumulates — and discounting begins.
Zara, on the other hand, commits to only 15–25% of a season’s line six months in advance. Up to 50% of its clothes are designed and manufactured right during the season. Twice a week, new stock arrives in stores. Twice a week, store managers send back real-time demand signals to designers.
The result?
Zara sells more products at full price
H&M relies more heavily on markdowns
Fast fashion brands like Zara reach inventory turnover ratios of around 12 annually — cycling through their entire stock roughly once a month
That’s not just operational efficiency. It’s a cash flow advantage that compounds over time.
The lesson for Indian brands isn’t to copy Zara’s model. It’s to internalise the principle: speed of movement matters more than volume of stock.
4. Inventory Turns and Inventory Days — Explained Simply
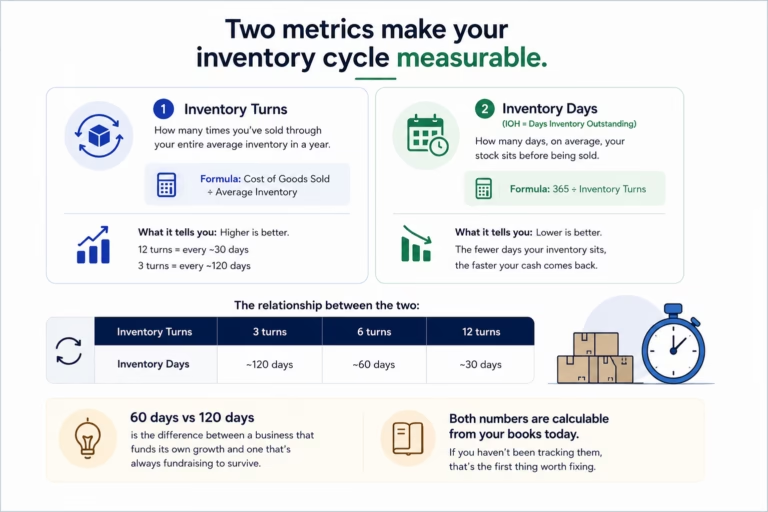
Two metrics make your inventory cycle measurable.
4.1 Inventory Turns
What it is: How many times you’ve sold through your entire average inventory in a year.
Formula: Cost of Goods Sold ÷ Average Inventory
What it tells you: Higher is better. A business with 12 turns is cycling through stock every ~30 days. One with 3 turns is waiting 4 months.
4.2 Inventory Days (DIO — Days Inventory Outstanding)
What it is: How many days, on average, your stock sits before being sold.
Formula: 365 ÷ Inventory Turns
What it tells you: Lower is better. The fewer days your inventory sits, the faster your cash comes back.
The relationship between the two:
Inventory Turns
Inventory Days
3 turns
~120 days
6 turns
~60 days
12 turns
~30 days
The difference between 60 days and 120 days isn’t just operational. It’s the difference between a business that funds its own growth and one that’s always fundraising to survive.
Both numbers are calculable from your books today. If you haven’t been tracking them, that’s the first thing worth fixing.
5. The Indian Context
India’s organised fashion retail is at USD 60+ billion and growing fast. But scale without inventory efficiency is expensive.
Here’s how the gap shows up across Indian brands:
5.1 Trent (Westside & Zudio) — What Good Looks Like
Trent is the clearest Indian example of inventory discipline at scale.
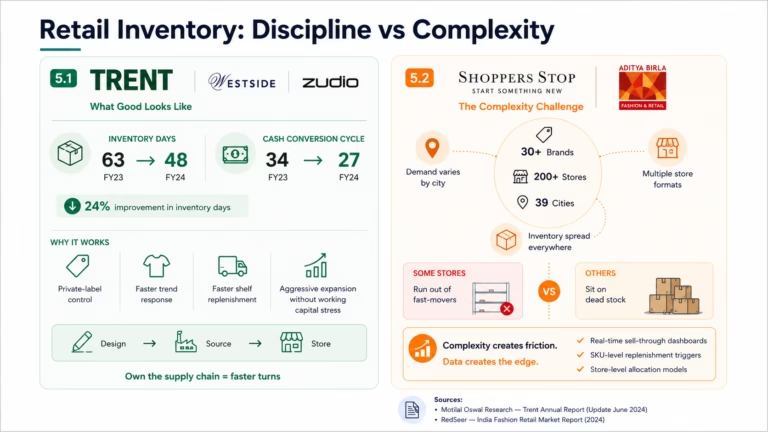
Inventory days improved from 63 days (FY23) to 48 days (FY24) — a 24% improvement in a single year
Cash conversion cycle came down from 34 days to 27 days in the same period
This happened while the company was aggressively adding new stores
How? Trent’s private-label model — owning design, sourcing, and retail — lets them reduce the lag between what customers want and what hits the shelves. Zudio in particular is built around fast-moving, trend-led fashion at accessible prices. That combination naturally drives faster turns.
5.2 Shoppers Stop & ABFRL — The Complexity Challenge
Shoppers Stop and ABFRL face a structurally harder problem. Both manage multi-brand portfolios across large store networks with owned and consignment inventory.
When you’re stocking 30+ brands across 200+ stores in 39 cities, demand forecasting gets genuinely hard.
Inventory is spread across cities and store formats
Demand varies by location, season, and format
Replenishment cycles are slower than digital-first brands
The result: some stores run out of fast-movers while others sit on dead stock — sometimes simultaneously.
This isn’t a strategy failure. It’s the natural cost of complexity. The brands gaining an edge are the ones investing in data infrastructure — real-time sell-through dashboards, SKU-level replenishment triggers, and store-level allocation models.
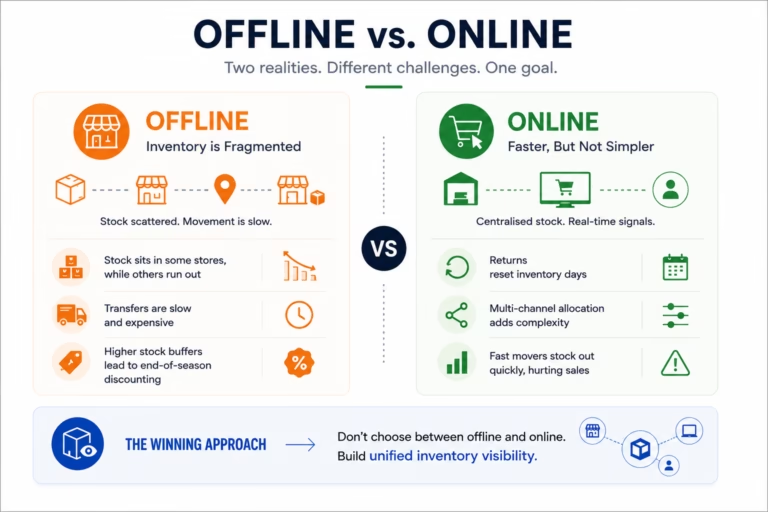
Most brands operate in both worlds. But inventory behaves very differently across channels.
6.1 Offline — Inventory is Fragmented
In physical retail:
Stock is distributed across stores — a product selling out in one city may be sitting unsold 200 km away
Movement between locations is slow and expensive
Demand is highly localised — a store in Indore may have very different sell-through patterns than one in Bengaluru
This leads to:
Higher buffer stock at every location
Longer inventory days on average
A discounting obligation at the end of every season
6.2 Online — Faster, But Not Simpler
Online channels centralize inventory and give you real-time demand signals. Turns are typically higher — the overall e-commerce sector averaged a turnover ratio of 10.19 in Q4 2024, many eCommerce businesses aim for a range of 4–6 turnovers annually. Top performers often achieve a ratio of 8 or higher.
But online introduces its own complications:
Returns reset inventory days. A product sold on Day 1 may be back in your warehouse by Day 15
Multi-channel allocation gets complex when stock committed to one marketplace can’t move when demand spikes on another
Fast-moving SKUs can go out of stock quickly, hurting conversions
The brands managing this well aren’t choosing between offline and online. They’re building unified inventory visibility — one view of stock, regardless of where it sits.
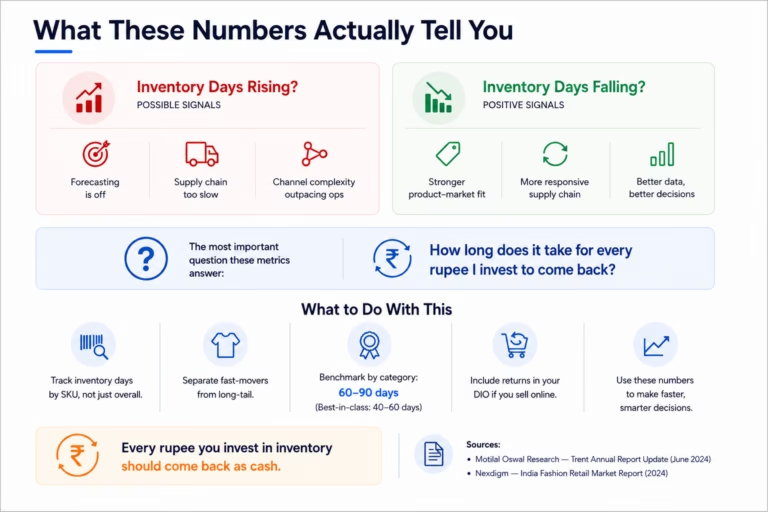
7. What These Numbers Actually Tell You
Inventory Turns and Inventory Days are not just operational metrics. They’re diagnostic tools.
If your inventory days are rising, it usually signals:
Demand forecasting is off — you’re ordering based on optimism, not real sell-through data
Your supply chain is too slow to respond to what’s actually moving
Channel complexity has outpaced your operations
If your inventory days are falling, it usually means:
Product-market fit is tightening — you know what sells and you’re stocking it
Supply chain is getting more responsive
Your data is improving — decisions are based on sell-through, not gut
The most important question these metrics answer — and that most dashboards don’t show you:
How long does it take for every rupee I invest to come back?
What to Do With This
Track inventory days by SKU, not just overall. An average can hide the fact that 20% of your catalogue turns in 30 days while 40% hasn’t moved in 90.
Separate fast-movers from long-tail. Replenishment strategy, pricing, and markdown timing should all differ between these groups.
Set a category benchmark — apparel retail in India typically runs at 60–90 inventory days. Best-in-class operators are pushing toward 40–50.
Build returns into your DIO calculation if you sell online. Effective DIO ≠ nominal DIO.
8. Conclusion
Revenue tells you how big your business is. Margins tell you how profitable it is.
But Inventory Turns and Inventory Days tell you whether your business is built to last.
A brand growing revenue while inventory days stretch is building a fragile machine — one that needs more and more capital to sustain what should be self-funding.
A brand compressing inventory days while growing is building a compounding advantage. Every rupee works harder. Every season ends cleaner. The next production cycle starts stronger.
The businesses that win in India’s next decade of retail growth won’t just be the ones with the most stores or the sharpest product. They’ll be the ones who figured out how to make their capital move as fast as their customers do.
That starts with knowing your number — and knowing what’s driving it.
- Cash flow is critical; inventory ties up capital, impacting business sustainability.
- Fast fashion brands like Zara excel by prioritizing inventory velocity over sheer volume.
- Tracking inventory turns and days is essential for understanding cash efficiency and operational health.
Enter your details below to get instant access to [enter lead magnet name here]
We process your personal data as stated in our Privacy Policy. You may withdraw your consent at any time by clicking the unsubscribe link at the bottom of any of our emails.