



Over the last ten months I’ve been managing Dilse Omni, our podcast, and most of that time I’ve been obsessed with the analytics. Sitting with the numbers after every episode, trying to work out what held people and what lost them. A lot of it was being wrong about which number to look at.
We post on both YouTube and Instagram, but it’s YouTube I keep going back to. Its analytics are about ten times deeper than what Instagram gives you. On YouTube you can work out why, and that’s the difference between guessing and fixing.
Because the honest version of being a creator is this: you upload, you check the numbers, you upload again. And somewhere in there you start wondering when this turns into something. For most people that something is monetisation.
YouTube just made that harder. From February 2027 the watch hours a new channel needs to get into the Partner Program doubles, from 4,000 to 8,000. The subscriber requirement doesn’t move.
Which tells you what they’re really counting. Not subscribers. Not views. Hours.
So watch hours is the North Star. The problem is you can’t work on it directly. It’s the total of a lot of smaller things going right, and each of those has its own number sitting in YouTube Studio.
That’s what the five metrics below are. Not a list of numbers to track, but the route to the only one that pays.
1. Why views and subscribers mislead you
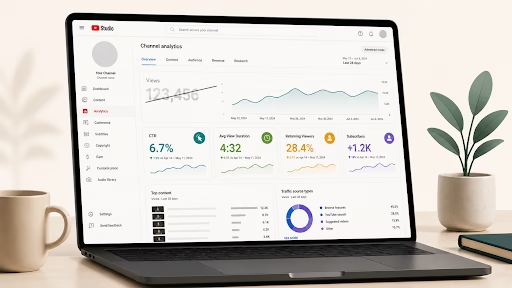
From the outside, when people judge a channel, they look at two numbers: subscribers and views. For the longest time, I did the same. Big number, good day. Small number, bad day.
But both are vanity metrics, and subscribers especially so. You can build a subscriber count by running ads. Plenty of channels have big subscriber numbers and videos that get almost no traction. Having subscribers doesn’t, on its own, make the channel work.
2. The real North Star
So if subscribers aren’t it, what is? Same question whether you’re looking at one video or the whole channel.
The North Star is whether people are actually watching.
Now, watching means two things. It means views, and it means the time people spend. Those two come apart faster than you’d think.
You can get views by running ads. You can build subscribers by running ads. You can’t buy watch time. Getting someone to hand over ten minutes of their evening is the most honest signal a channel produces, and it’s the number I’d optimise for above everything else.
This shows up in what you make, too. If you’re chasing views, Shorts will get you there fastest. If it’s watch time you’re after, it has to be long-form. A Short can pull huge numbers and add almost nothing to the hours people spend on your channel.
Which is why most good channels run on long-form, with Shorts doing the job of bringing new people in.
3. The Viewer’s Journey
Before we get into the five metrics, here’s the idea that made all of them click for me.
I stopped seeing my channel as a scoreboard and started seeing it as a journey every viewer takes. Someone is scrolling their feed. They see your video. They click. They watch. If it holds them, they stay to the end. If that keeps happening, they subscribe and come back for the next one.
They see it → they click → they watch → they stay → they come back → YouTube starts recommending you.
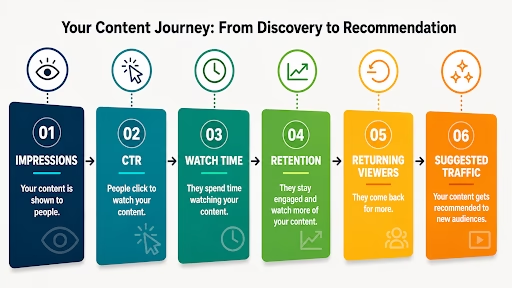
Each step only happens if the one before it went well.
And it really comes down to two steps.
Step one is getting traffic. That’s everything up to the click.
Step two is driving retention. That’s everything after it, and it’s the half that sits genuinely in your hands.
Almost every problem on a channel is one of those two, and they need completely different fixes. A video nobody clicks has a step-one problem. A video people click but don’t finish has a step-two problem.
So instead of asking “why aren’t my views growing,” I started asking “which step is leaking?” That’s a much easier question to answer, because it points at one specific thing to fix instead of the whole channel.
4. The Five Metrics
Here they are, in the order a viewer actually moves through them.
4.1. Traffic
Someone has to see the video before anything else can happen.
So I start with impressions and views, both under Reach in Studio. Impressions is how many times YouTube showed your thumbnail to someone. Views is how many of those actually turned into a watch.
That’s the top of the funnel. A great video with no traffic is just a great video nobody watched.
Then the more useful question: where did it come from?
Some of it you bring yourself. The link you posted on LinkedIn, the WhatsApp group, the emailer. That traffic exists because you pushed it.
The rest comes from inside YouTube, either because the algorithm decided to show you to someone, or because you paid it to.
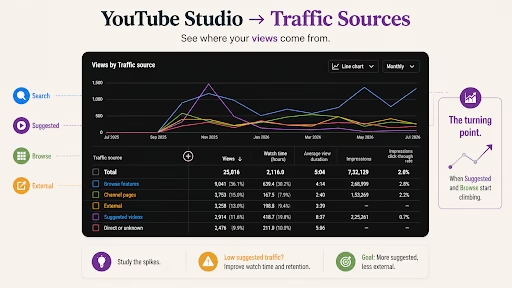
Early on, almost everything will be the first kind. That’s normal, and it isn’t a verdict on your content. It just means YouTube hasn’t picked you up yet. The shift you’re waiting for is the day Browse and Suggested start climbing on their own, because that’s YouTube doing the distribution instead of you.
If your traffic is low: the fix usually isn’t more promotion. Improve watch time and retention first. Organic reach is mostly a reward for videos that hold attention.
4.2. Click-Through Rate
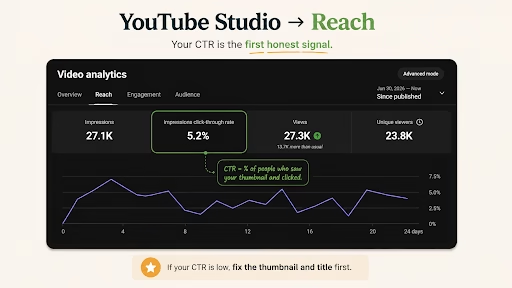
They’re now looking at your thumbnail, deciding in about half a second whether to click. That decision is your click-through rate.
It’s the share of people who saw your thumbnail and actually clicked it. Nothing else in this article can happen until someone clicks in.
CTR is really a function of your packaging: the thumbnail first, then the title, and to a smaller degree the description sitting under it. That’s all the selling you get to do at this stage.
The easiest way to think about it: YouTube shows your thumbnail to a small test audience first. If enough of them click, it shows it to more people.
Here’s the mistake that took me long to spot. I used to write titles to look complete: the topic, the name, a whole neat row of hashtags. Those videos consistently clicked worse. The moment I started writing titles the way I’d say them to a friend, the clicks went up. The content hadn’t changed. Only the packaging had.
Common Mistake: Writing your title for search and hashtags instead of for a real person scrolling their feed. The thumbnail and title are a pair. They sell the click together, not separately.
If your CTR is low: leave the content alone and rework the thumbnail and title first.
4.3. Watch Time
A click just means your packaging worked. Whether they stayed is a different question, and that’s what watch time answers.
If traffic is the top of the funnel and the thumbnail-to-click moment is the middle, this is the bottom. And it’s the part that sits entirely at our end. Traffic and clicks can be bought or borrowed. This one can’t.
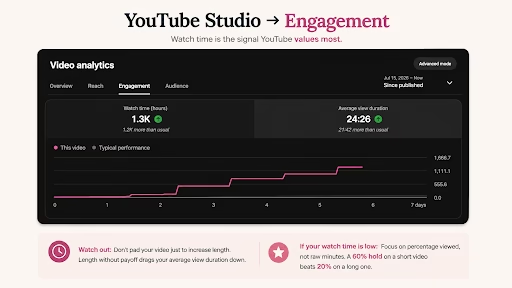
It’s also the signal YouTube leans on most. In its own words, its discovery system uses both absolute and relative watch time to judge engagement. That’s why a video with fewer initial views can outperform one that gets a big spike but loses viewers quickly.
My own data surprised me here. The videos that told a real story held people far longer than the ones that just explained a thing. Same channel, same audience.
Watch Out: Don’t stretch a video to make it look meatier. YouTube advises against padding, and the numbers punish it anyway. Say the thing, then stop.
If your watch time is low: look at percentage viewed, not raw minutes. A 60% hold on a short video beats 20% on a long one.
4.4. Audience Retention
Watch time tells you that people left. The retention graph tells you where.
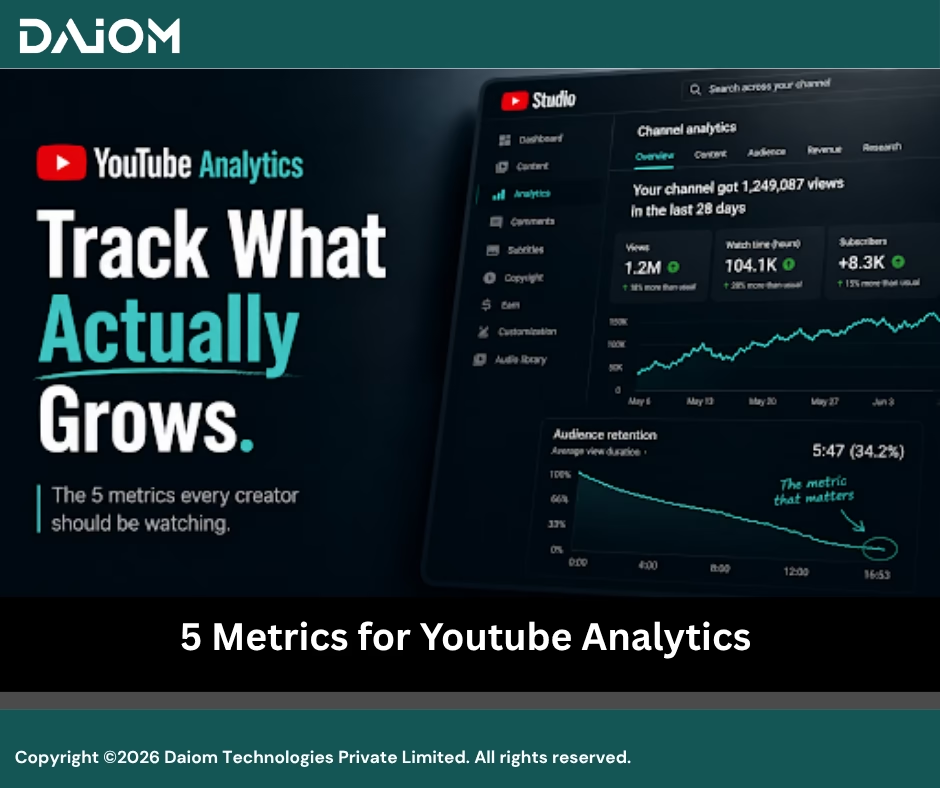
If I could keep only one chart, it would be this one, and hardly anyone opens it. You’ll find it on any individual video under Engagement → Key moments for audience retention.
Picture a line that starts near 100% at the beginning of your video and drops as people leave. It shows you, second by second, exactly where you’re losing them.
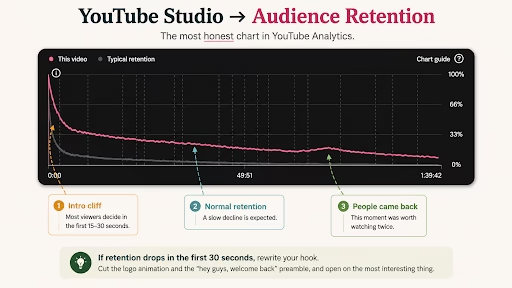
A steep cliff in the first 15 to 30 seconds is a hook problem, not a whole-video problem. A slow, gentle slope is normal. It’s the sudden drops you investigate.
When I started reading this instead of guessing, the culprit was almost always the same: long intros. People were gone before the good part began.
Pro Tip: Watch for the spots where the line bumps back up. That’s people rewinding to rewatch something. Whatever you did there, do more of it.
If retention drops in the first 30 seconds: rewrite your hook. Cut the logo animation and the “hey guys, welcome back,” and open on the most interesting thing you’ve got.
4.5. Returning Viewers
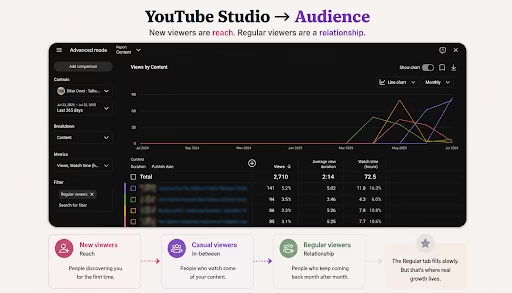
This is the one that tells you whether you’re building an audience or just publishing videos. It’s in the Audience tab, split into New, Casual, and Regular viewers.
New viewers tell you people are discovering you. Regular viewers tell you people have a reason to come back.
This is also where subscribers finally start to mean something. Nobody subscribes because you asked them to in the intro. They subscribe because they’ve watched you a few times and don’t want to miss the next one. Subscribing is the result of repeat watching, not the cause of it, and a subscriber earned that way is worth a hundred bought ones.
A channel that only ever pulls new faces is renting attention every time. It never compounds.
Common Mistake: Uploading random one-offs with nothing tying them together. If someone liked one video, there’s nothing obvious for them to watch next.
If your returning viewers are low: build a repeatable format or series instead of standalone videos, and actually tell people what’s coming next at the end of each one.
5. How to tell if people actually liked it
Watch time tells you people stayed. It doesn’t quite tell you they enjoyed it.
For that, look at your engagement ratios, which come down to two things:
- Likes against dislikes. The quickest read on whether a video landed or irritated people.
- Comments. Slower, but far richer. Comments tell you which specific bit hit hard enough that someone stopped scrolling to type.
Neither drives distribution the way watch time does, so I wouldn’t optimise for them. But when two videos have similar watch time and one has three times the comments, that’s telling you something real about which one people actually loved.
6. Turning this into monetisation
The Partner Program asks for 1,000 subscribers and 4,000 watch hours in a year. From February 2027 the hours go up to 8,000. Subscribers stay at 1,000.
I didn’t really understand what 8,000 hours meant until I did the maths on it. That’s 480,000 minutes. At an average view duration of four minutes you’d need about 120,000 views to clear it. At eight minutes, 60,000 does it.
Which means there are two ways to get there. Find twice as many people, or give the ones you already have a reason to stay twice as long.
The first is expensive and mostly out of your hands. The second is an edit.
That changed how I think about our episodes. Cutting a slow ten minutes out of a podcast used to feel like losing something. Now I can see it as the cheaper half of the same problem.
The Shorts route in doubles as well, from 10 million views to 20 million in 90 days. Set against 8,000 hours of long-form, it’s not really a competition. Shorts get you found. Long-form gets you paid.
And it doesn’t end at the threshold. Premium earnings are divided between creators by watch time and views, with long-form taking 55% of that pool against Shorts’ 45%. Watch time gets you in, then decides your share once you’re there.
So if monetisation is what you’re after, views aren’t really the number to count. Minutes are.
7. The cheat sheet
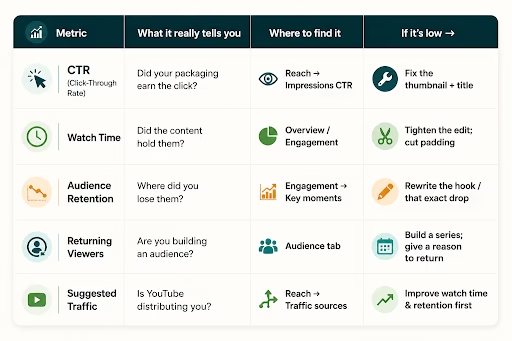
Here’s the whole thing on one card. Keep it next to you the next time you open YouTube Studio.
8. The one shift that changes everything
Subscribers and views measure the crowd that walked past your door. Watch time measures whether anyone came in, sat down, and stayed.
Of everything on the dashboard, that’s the one I’d optimise for. The rest still matter, but they mostly feed into this one anyway.
Reading the analytics this way made the whole thing less stressful. A bad week stopped feeling like a verdict on the channel and started being something I could look into. Usually it came down to one step in the funnel, and once I knew which one, I knew what to go and fix.
So next time you go to check the view count, open the retention curve instead. It’ll tell you a lot more.
Because the numbers on the outside are just the crowd. The real growth is in the watch time.