




Every few weeks I see a founder celebrate a record sales month, and I think the same thing: great, but what is that sale built on? A discount? A festive spike? Or a brand people genuinely remember and reach for?
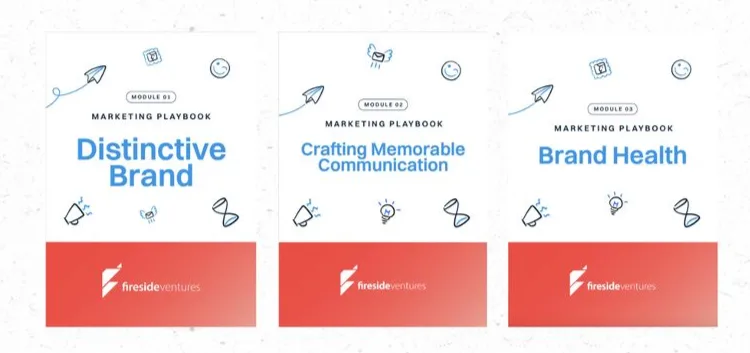
I recently went through the Module 03 of Fireside Ventures’ Marketing Playbook, which is all about measuring brand health. It changed how I look at dashboards. Its opening line says it plainly: as you scale, you could be getting growth without the fundamentals strengthening. Here is what I took from it.
Stop relying on vanity metrics
Many brands confuse visibility with impact. Likes, views, and reach are great for awareness, but they don’t always translate into real growth. That’s where the difference lies: vanity metrics tell you how many people saw your campaign, while business metrics tell you whether it actually moved the needle.
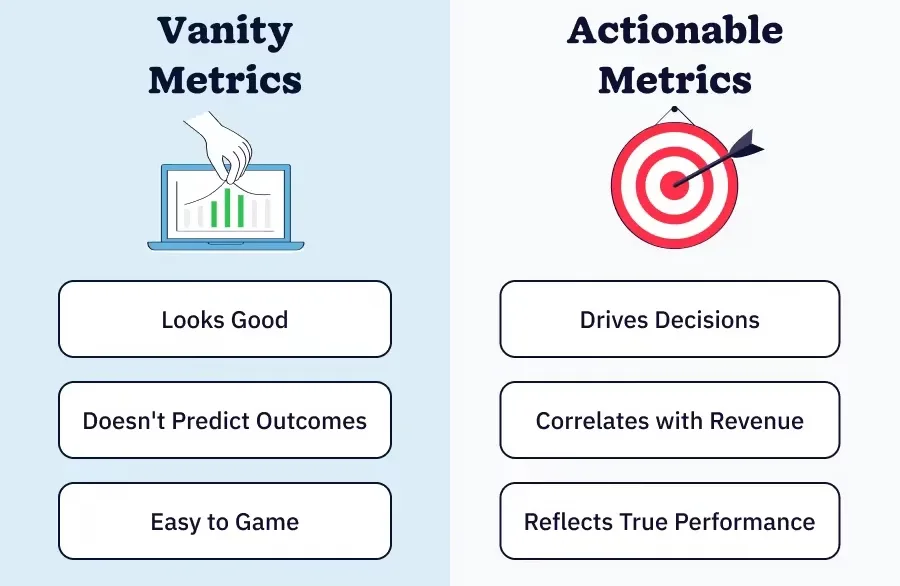
Likes, reach and clicks are easy to collect and easy to love. The playbook’s advice is blunt: don’t let vanity digital metrics distract you from brand fundamentals. It offers three tools that give you both numbers and the story behind them.
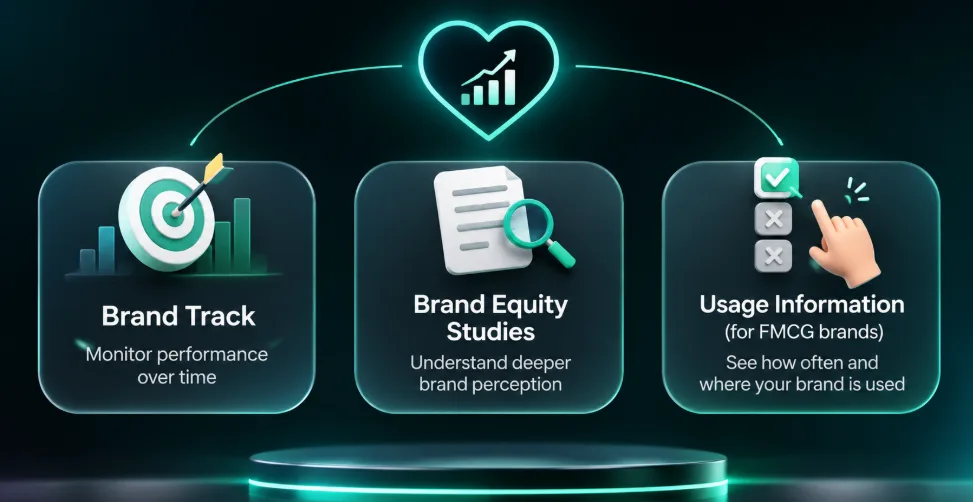
Three ways to read brand health. Source: Fireside Ventures, Module 03.
The brand track: your rear-view mirror
If brand building is about mental availability, the brand track is how you measure it regularly. It is a survey of category buyers about what they remember and associate with brands in your category. The playbook calls it a rear-view mirror, because the past is a decent predictor of the future.
Two practical rules stood out. You don’t need a tracker before product-market fit. Start once you are spending more than ₹1.5 crore a month on reach-building advertising, on any medium. And design it around three principles.
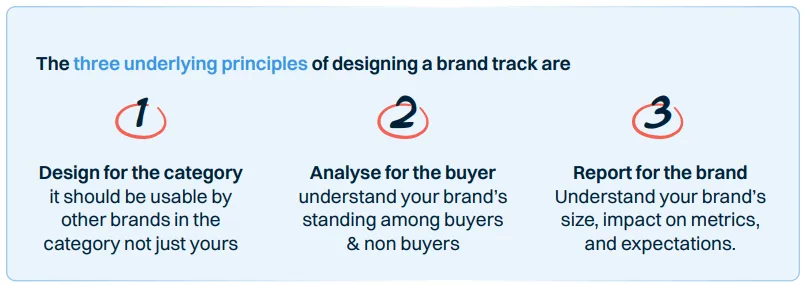
Design for the category, analyse for the buyer, report for the brand.
Getting the “who” right
This is where most teams slip. Survey category buyers and decision makers, defined the way a consumer would define the category, not the way your internal team does. The module’s example for Sweet Karam Coffee made it click for me. Tracking only murukku, chips and mixtures is too narrow. “Any snack” is too wide. The right starting point is packaged Indian snacks.

Its Pro Tip is a good one: don’t restrict to only big brands, because local brands are also options for the consumer.
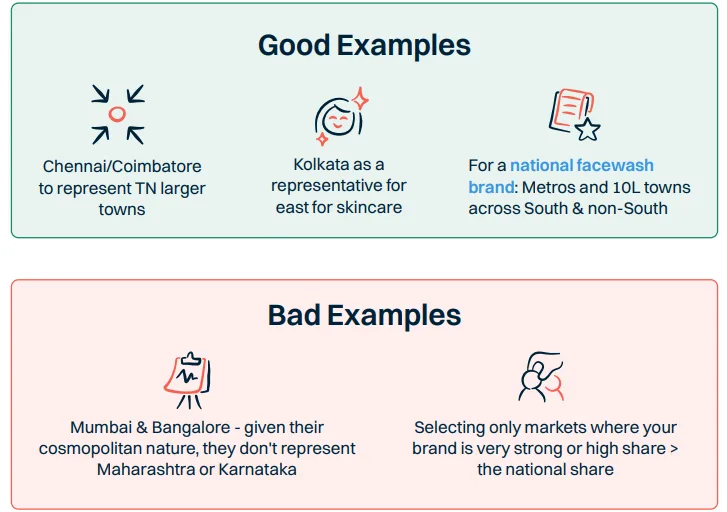
Markets follow the same logic. Chennai or Coimbatore can represent Tamil Nadu’s larger towns. Mumbai and Bangalore can’t represent Maharashtra or Karnataka, because they are too cosmopolitan. And never pick only the markets where you are already strong.
Criteria:
- Markets that are important to the category based on contribution to category sales
- Markets that represent a wider region or state or town-class, don’t include cities which tend to be ‘islands’ whose learnings don’t transfer outside of it
- For brands with limited presence, select markets where you are investing to build your brand
- For brands with pan India presence, select a mix of strong & weak markets for your brand
How often should you conduct the brand track?
Quarterly is enough for smaller businesses.
Large FMCG and consumer tech brands go monthly. More than monthly is not recommended or needed.
Seasonal categories like ice cream or winter skincare can run twice a year, once in season and once off. Sample sizes of 150 to 250 per cell are enough, since more only adds cost.
The part I found most useful is the warning about gaps between readings. Look at the two charts below. With only February and May, awareness looks like it is climbing. Add September, and you see it peaked in May and has been falling since.
Infrequent data captures carries the risk of not being able to see the real trend. So do be cognizant of that when reading the data (see graphs below to understand). What may appear to be an increasing awareness in 2 dipsticks done in Feb and Sept, may actually be falling after peaking in May which can be missed if a round is not conducted in May.
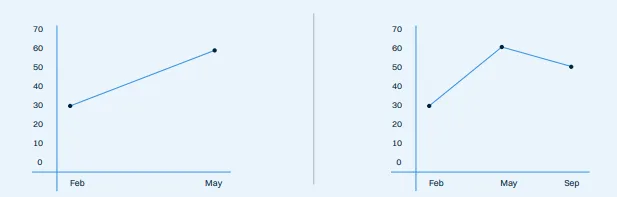
Infrequent readings can hide the real trend. Source: Fireside Ventures, Module 03.
What to actually ask?
- Awareness and salience
- Spontaneous awareness (brands named unaided) is the best proxy for mental availability in CPG. For small, new or hard-to-pronounce brands, aided awareness matters more.
- Top of mind awareness (TOM), first brand that comes to mind for the category
- Usage. Ever tried, tried in the last year, last purchased, most often used. Future consideration is left out because it shifts with the occasion.
- Profile. Demographic information, household information, any other category penetration information relevant for this category (e.g. credit card, loan usage in a banking survey), any other relevant behavioural information
- Category entry points. Instead of asking “would you consider us?”, ask which brands come to mind for a situation, like “when I need food in 10 minutes”. The module says this suits new and niche brands best.
- Brand imagery. Keep the attribute list to 15 to 20, with 60 to 70 percent tied to entry points. Longer lists tire respondents.
- Campaign recall. A lean check that your video ads registered with the right branding and message.
Brand equity: are you meaningfully different?
Equity is what your brand is worth in the consumer’s mind. Kantar’s MDS framework scores brands on being Meaningful, Different and Salient. The chart is the one I’d put on a slide for any founder who thinks awareness alone is enough.
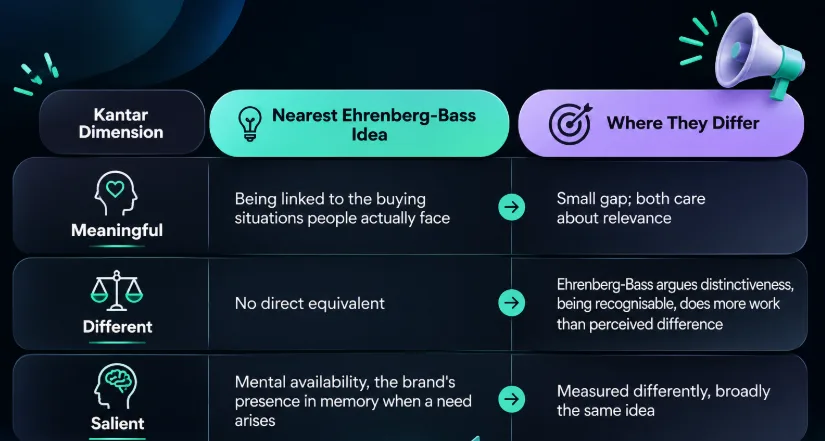
Growing salience with a strong meaningful difference delivered 2.7% market share growth, against 0.9% for weak. Source: Kantar BrandZ studies 2014-2020, via Fireside Ventures.
The quantitative score comes from your tracker and is reported quarterly. Deeper qualitative studies, through interviews or focus groups, are done every two to four years, like a full-body health check.
Usage information: what people actually buy
Surveys tell you what people say. Usage information tells you what they actually do. This is the third tool in the playbook, and it’s mainly for FMCG brands.
Your own sales data shows how much you sold, but not what’s happening in the category around you. For that, brands use household panels. These are groups of families who agree to share their shopping bills, bin audits and purchase diaries, so you can see what they really buy. From this you can read:
- Penetration: how many households buy your brand
- Frequency: how often they buy
- Consumption: how much they use
- Lapsing: how many stop buying
The most useful part is gain and loss analysis. Compare two time periods and it shows why your sales changed: did customers switch to or from a competitor, join or leave the category, or simply buy more or less? Once you know that, you can fix the real problem instead of guessing from the sales number.
Be patient with the gym analogy
My favourite FAQ answer compares brand building to the gym. Measure your biceps daily and you’ll see nothing. Come back after a few months and the change is obvious. The module says to expect brand power to take six to nine months to move, and qualitative perception around two years of sustained effort. Salience moves first.
It also has a warning for performance-heavy teams. If 80 to 90 percent of your budget goes to performance marketing, it may convert well, but it is unlikely to build your brand for the future. It reaches people already in the market.
What I’m taking away
Here are the 3 key takeaways from the blog:
- Sales show what happened, and brand health shows why. Don’t let vanity metrics replace brand fundamentals. Use a brand track, equity studies and usage data.
- Run your brand track carefully. Start once you spend more than ₹1.5 crore a month on reach, survey category buyers in representative markets, and track quarterly.
- Being meaningfully different drives growth, and it takes patience. Brands with strong meaningful difference grew market share 2.7%, against 0.9% for weak ones. Expect brand power to take 6 to 9 months to move.
For a young brand, I’d start small:
- define the category the way customers do,
- pick a couple of representative markets, track quarterly,
- read the trend before reacting to any single dip.
- And talk to real customers, because the module also asks brand and product teams to meet five to ten consumers a month.
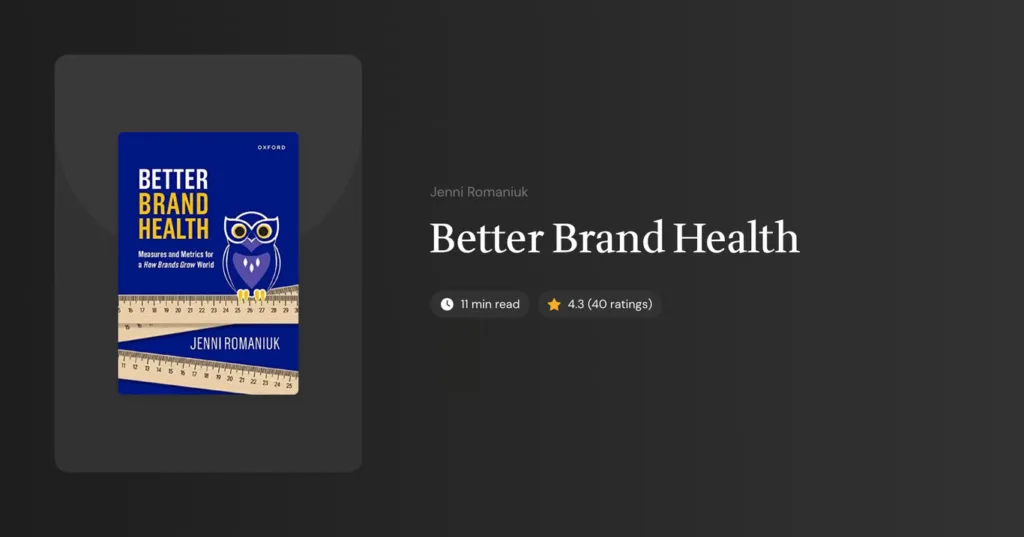
Further reading. The playbook recommends Better Brand Health by Jenni Romaniuk of the Ehrenberg-Bass Institute for the nuances of measurement.
Source: Fireside Ventures Marketing Playbook, Module 03: Brand Health. All data points, frameworks and figures are from the module; the Kantar chart is credited there to Kantar BrandZ studies, 2014-2020.