Let’s say this month’s retention rate has dropped. The first instinct might be to fix onboarding, update your campaign, or check for product issues.
But the real issue might not be what happened — it might be who it happened to.
That retention number is an average, and averages can hide important details.
What if most of the users who churned came from a festival sale? Or from a low-intent channel like giveaways or heavy discounts?
To get clarity, you need to ask:
- Who were these users?
- When did they join?
- What did their journey look like?
That’s where cohort analysis helps. It groups users by a shared starting point and tracks how their behavior changes over time — so you can stop guessing and start acting on real patterns.
“You can’t improve what you don’t understand. Cohort analysis helps you stop guessing and start optimizing.”
— Brian Balfour, Former VP Growth @ HubSpot & Founder of Reforge
Table of Contents
1. Cohorts vs Segments
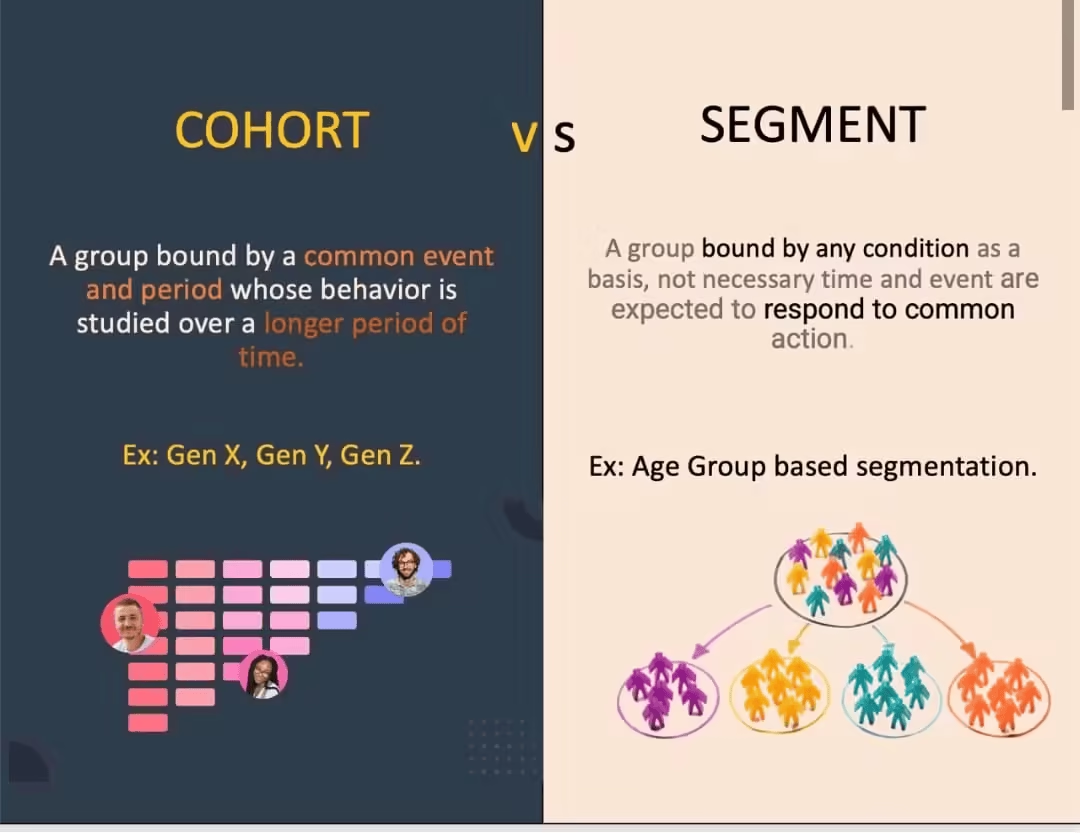
At first glance, cohorts and segments can seem similar. Both group users. Both help you analyze performance. But once you start using them in real-world scenarios, the difference becomes clear — and important.
You can consider segments as a snapshot. They tell you who your users are at a single point in time. For Example: You run an online clothing store. You create a segment of users who:
- Are from Tier 1 cities
- Visit your website via Instagram ads
- Added items to cart in the last 7 days
This segment helps with targeted offers or retargeting. But it doesn’t tell you anything about what these users did after.
Did they complete the purchase? Did they come back?
That’s where segments fall short — they show identity, but not behavior over time.
Now let’s come to cohorts.
A cohort groups users who did something specific during the same time frame — and tracks how their behavior unfolds over time. Let’s say you build a cohort of users who signed up between July 1–7. You then track this group for 30 days:
- How many made a second purchase?
- When did they drop off?
- How do they compare to the June 24–30 cohort?
This is where t=0 vs. t=t comes in. At t=0, cohorts start from a shared action (like first purchase). At t=t, segments show what users look like right now.
Read more – Cohort Vs. Segment: Are Brands Using These Terms Correctly?
1.1 A Simple Business Example
Consider you launched a new coffee subscription plan.
- A segment can show you that 60% of current subscribers are aged 25–34 and live in metro cities.
- But a cohort will show that users who subscribed during the March campaign had a 40% churn rate by Day 15 — while the April cohort stayed longer.
Now you know the real problem isn’t “who” your users are — but when and how they joined, and what made them stay (or leave).
In short:
- Use segments to understand your audience.
- Use cohorts to understand their behavior over time.
2. Origin of Cohorts
Cohort analysis didn’t start with marketing dashboards or product analytics. It actually began in medicine. Back in 1948, doctors started the Framingham Heart Study in the U.S.
They followed over 5,000 people from one town — none of whom had heart disease at the time. Over many years, they tracked their lifestyle habits and health outcomes. This helped doctors understand what factors led to heart disease later in life.
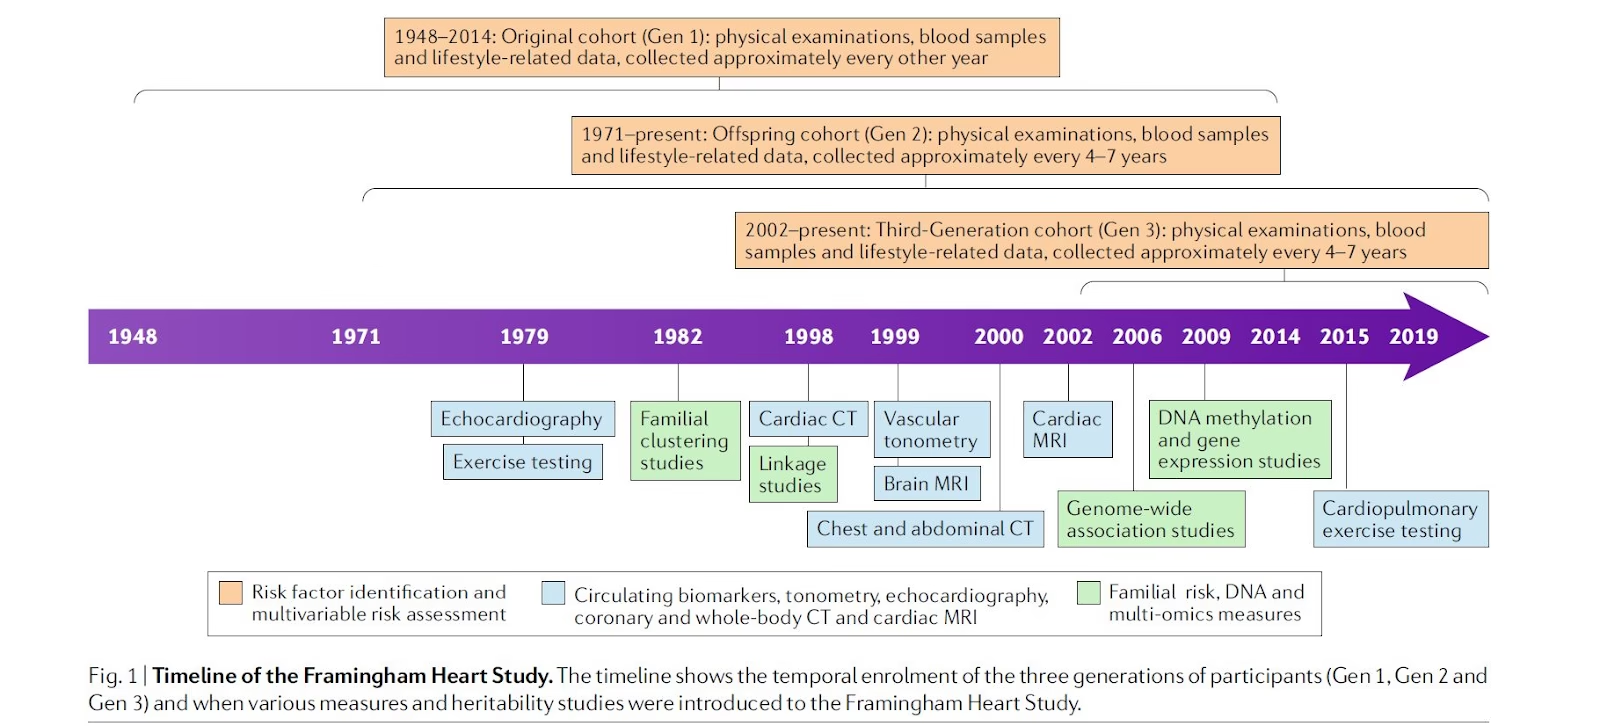
That group of people — who all started from the same point — became what we now call a cohort.
2.2 Is a Cohort the Same as a Longitudinal Study?
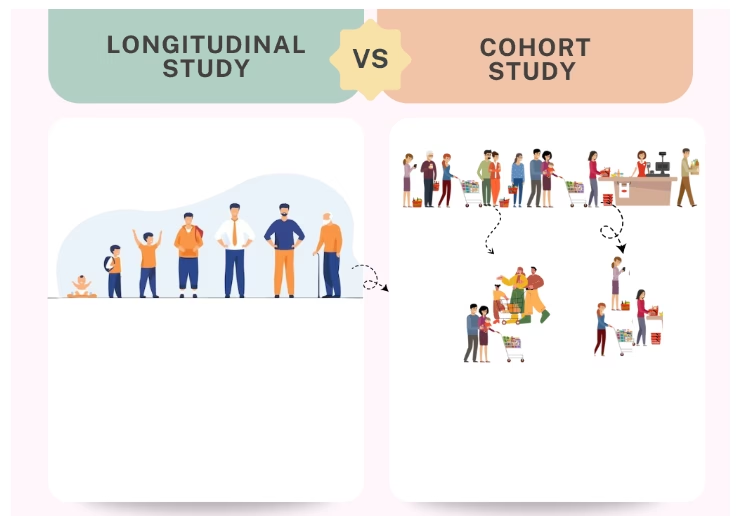
A cohort study is a type of longitudinal study, but it’s important to understand the difference between the two.
A longitudinal study involves repeatedly observing the same individuals over an extended period to detect changes over time.
A cohort study, on the other hand, is a specific kind of longitudinal study that focuses on a group of people who share a common characteristic or experience within a defined time period — such as being born in the same year, being exposed to the same drug, or living in the same geographic area.
Every cohort study is longitudinal because it tracks a group over time. But not all longitudinal studies are cohort studies. For example, a longitudinal study might follow a random sample of people from the general population, even if they don’t share any specific event or trait — this is often called a panel design.
So while cohort studies fall under the umbrella of longitudinal research, what sets them apart is the shared starting point or defining trait of the group being studied.
3. Cohorts in Daily Life
You may not realize it, but you use cohorts all the time in everyday life.
Whenever you compare how millennials behave differently from Gen Z, or talk about kids who grew up during the pandemic, or refer to “first-jobbers” or “COVID-era graduates”—you’re thinking in cohorts.
That’s because a cohort simply means a group of people who went through the same event or time period and were shaped by it in similar ways.
3.1 Generations Are a Type of Cohort
Let’s take a look at generations:

- Gen X (1965–1980): Grew up before the internet.
- Millennials (1981–1996): Got mobile phones, student loans, and social media.
- Gen Z (1997–2012): Grew up online with TikTok and AI tools.
These groups don’t just use different apps — they see the world differently because of when and how they grew up. That’s what makes them cohorts.
So when Gen Z expects fast replies or gets bored quickly, it’s not just a preference — it’s the result of shared life experiences.
3.2 Same Behavior, Different People
During the COVID-19 pandemic, people across all ages started doing new things:
- Ordering groceries online
- Trying home workouts
- Discovering D2C brands
They may have been from different cities or age groups, but they showed similar behavior because of the same trigger — the pandemic. That’s a cohort.
4. Cohorts in Analytics - Customer
Let’s say a customer buys something from your store. Here’s what you know:
- Customer: Ayesha
- Location: Mumbai
- Date: March 12
- Product: Vitamin C Serum
his one purchase may look simple — but when you zoom out and group similar customers together, you get powerful insights. That’s where cohorts come in.
4.1 3 Types of Customer Cohorts You Can Build
Depending on what you want to learn, you can group customers by time, product, or location. Each one reveals a different kind of insight.
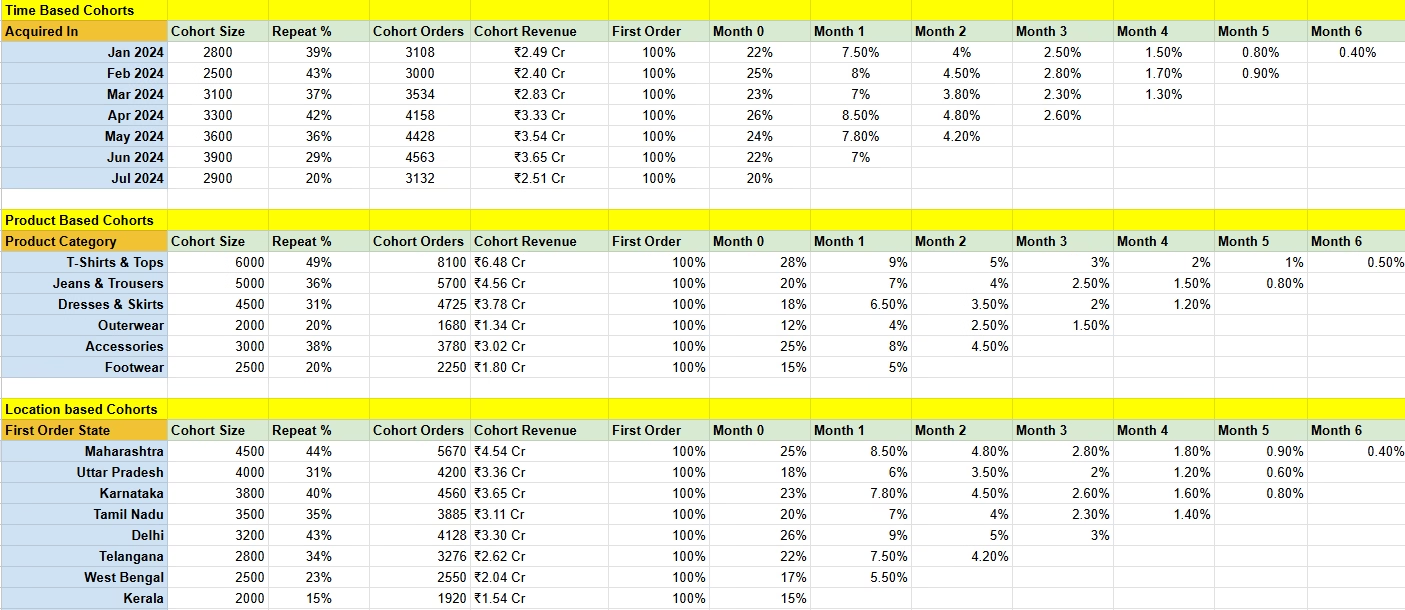
Time-Based Cohort: Group customers based on when they made their first purchase.
Examples from table:
Feb 2024 cohort had highest repeat % (43%) — indicating strong retention or performance of campaigns from that month.
Jul 2024 cohort has the lowest repeat % (20%) — likely still maturing, but early drop-off suggests onboarding issues.
Apr 2024 saw a spike in Month 1 repurchase (8.5%), suggesting successful remarketing right after the first purchase.
Use case: Marketers can double down on campaigns similar to Feb 2024’s strategy or investigate what went wrong in June–July.
Product-Based Cohort: Group customers by the first product they bought.
Examples from table:
T-Shirts & Tops drive the most orders (8100) and have the highest repeat % (49%) — a core acquisition product.
Footwear has a low repeat % (20%), possibly indicating sizing issues, seasonal appeal, or poor product experience.
Accessories have decent performance with a 38% repeat rate, but lower Month 1 activity (just 8%) — could improve re-engagement.
Use case: Optimize product mix for acquisition and lifecycle value. Push T-shirts as entry point, then upsell to Jeans/Accessories.
Location-Based Cohort: Group customers by where they’re from.
Examples from table:
Maharashtra is the strongest-performing state: highest cohort revenue (₹4.54 Cr) and repeat % (44%).
Kerala shows the lowest repeat rate (15%) and minimal retention after Month 1 — an opportunity to refine region-specific messaging.
Delhi has high early repurchase (Month 1 = 9%) but low overall repeat (36%) — strong early engagement, weak long-term.
Use case: Helps geo-target future campaigns. Double down on Maharashtra-style playbooks; rework messaging for low-retention regions like Kerala.
4.2 Metrics for Cohorts
Once you’ve grouped your customers into cohorts, you can start tracking how they behave over time. Some key things to measure are:
- First Order to Repeat Rate – It shows how many customers came back after their first purchase.
- Customer Lifetime Value (CLTV) – How much total money each group brings in over time.
- Average Order Value (AOV) – It shows whether or not some groups are spending more per order than others.
Read more – Metric of the Week: Customer Lifetime Value (CLV)
5. Cohorts in Analytics – Leads
Cohort analysis isn’t just for tracking existing customers — it’s equally powerful when applied to leads. Whether it’s someone who filled out a form, signed up for a demo, or clicked on an ad, understanding how different groups of leads behave over time helps you improve conversions and optimize your funnel.
Let’s take a sample lead:
- Lead Source: Facebook Ad
- Time: 5th June
- Location: Pune
From this one data point, you can group similar leads into cohorts based on what you want to measure — and when.
5.1 Customer vs Lead: Does Cohort Analysis Work for Both?
Yes — cohort analysis is useful for both leads and customers, but what you track changes based on the stage they’re in.
- Leads: You focus on acquisition cohorts — when and where the lead came in, and whether they eventually converted.
- Customers: You focus on retention and revenue cohorts — when they made their first purchase, what they bought, and how they behaved after.
5.2 Types of Lead Cohorts You Can Build
Depending on what you want to analyze, you can group leads based on when they came in, where they came from, or where they’re located. Each type of cohort gives you a different layer of insight.
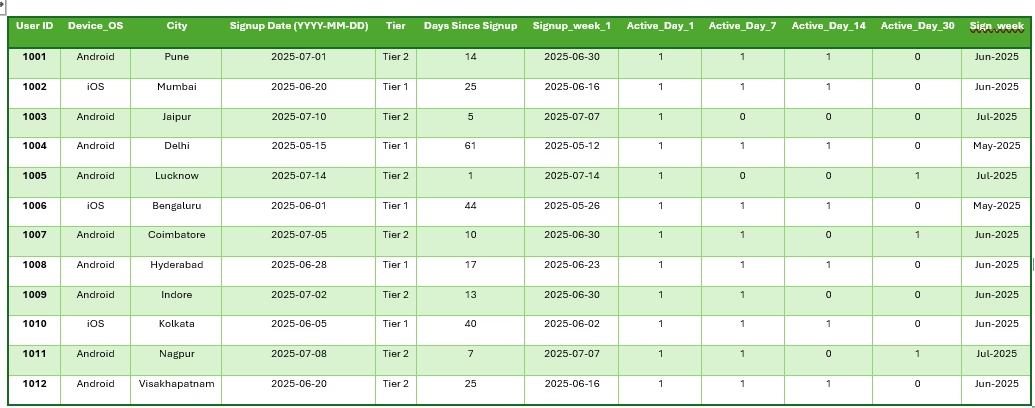
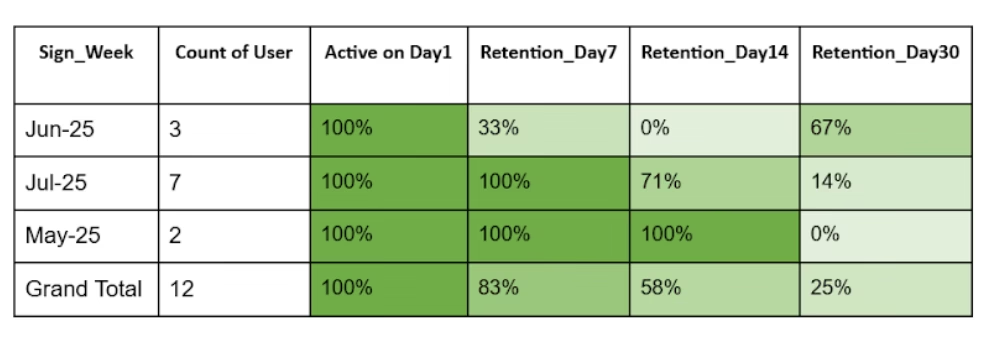
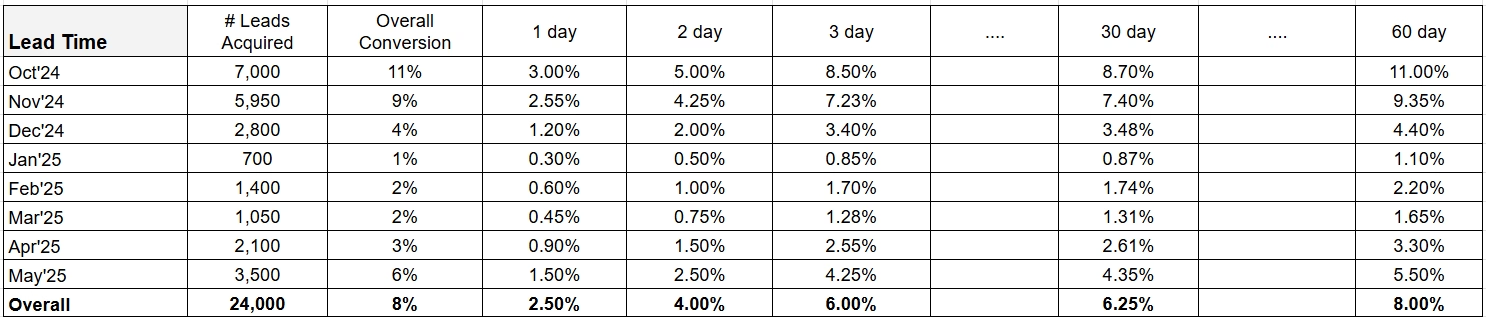
Time-Based Cohort: Groups leads based on when they first entered your system, like by week or month. Example: All leads who signed up in June 2025. This helps you compare how different time periods perform in terms of conversion and quality.
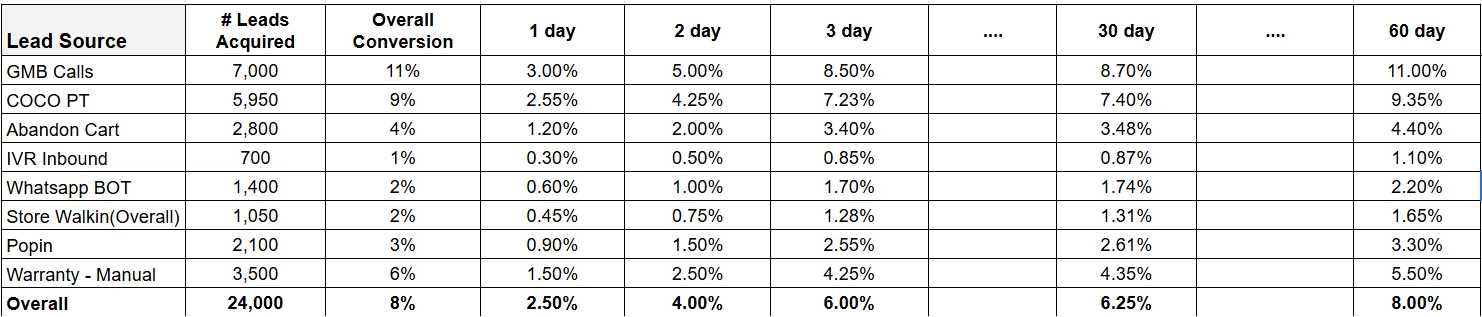
Lead Source Cohort: Groups leads by how they discovered your brand — such as Facebook Ads, SEO, webinars, or referrals. Example: Leads from LinkedIn Ads vs Organic Search. This helps you see which channels are bringing in the most valuable leads.
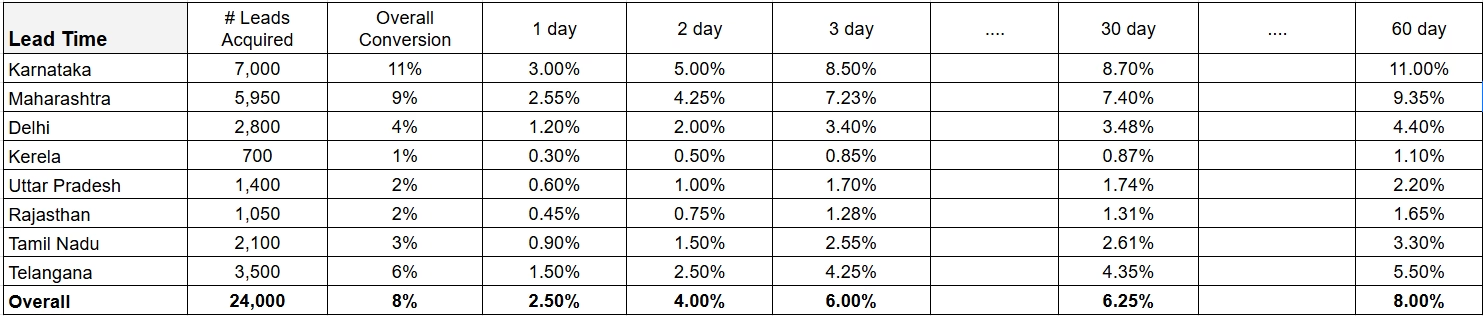
Location-Based Cohort: Groups leads based on their geographic location. Example: Leads from Delhi vs Chennai. This is helpful when you want to measure regional performance or run city-specific campaigns.
5.3 Metrics You Can Track Across Lead Cohorts
Once you’ve created cohorts, the real value comes from tracking how they perform over time. These are the key metrics to look at when measuring lead quality and impact.
- Leads Captured and Conversion Rate: How many leads came in from each cohort, and how many turned into paying customers?
- Lead Revenue: What’s the total revenue earned from the leads that are converted in each cohort?
- Lead Average Order Value (AOV): Among the leads who became customers, how much did each one spend on average?
By combining cohorts and these metrics, you get more than just numbers — you get a timeline of lead behavior, which helps you find the best sources, improve follow-ups, and make better marketing decisions.
5.4 How Special Events Like Mega Sales Affect Cohorts?
Big sales events affect different cohorts differently. Here’s what to watch:
- Existing Customer Cohorts: Usually show high repeat rates and AOV during sales.
- New Customer Cohorts from Sale: May convert quickly, but often have lower LTV and retention after the event.
- Lead Cohorts: Show higher conversion rates in sale months.
- New Leads Acquired During Sales: Often have better conversion but weaker post-sale engagement.
6. Types of Cohorts in Customer Analytics
Not all cohorts are created equal. Depending on what you’re trying to understand — acquisition, engagement, retention, or revenue — you’ll need to group users differently.
Here are the most commonly used cohort types in customer analytics, along with when to use them and what metrics to track.
6.1 Customer Cohorts
These are groups of users who became customers around the same time — like the same week or month. Tracking them helps you understand how onboarding impacts their behavior.
For example, if customers who joined in March dropped off faster than those in February, it could point to a change in the onboarding experience or a bug. By comparing Day 1, Day 7, and Day 30 retention or churn across these cohorts, you can pinpoint where and when users start losing interest.
6.4 Product Cohorts
This type groups users based on the first product or feature they interact with. It helps you find out which products are most engaging and what makes people come back.
6.3 LTV (Revenue) Cohorts
These group customers based on how much they spend over time. It helps you identify which group brings the most value and why.
7. Common Mistakes People Make With Cohorts
Cohort analysis can be a powerful tool — but only if used the right way. Many teams fall into easy traps that reduce its value. Here’s what to avoid:
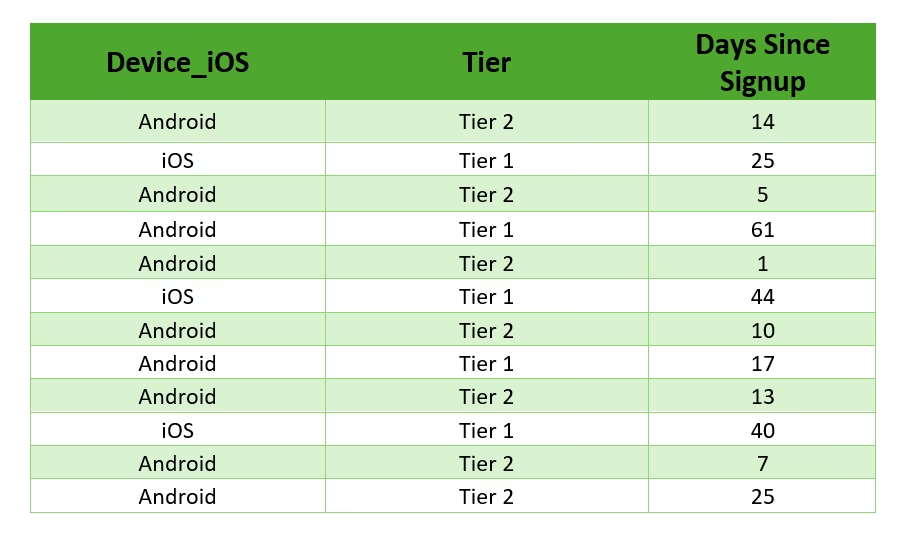
- Treating Cohorts Like Segments: Segments group users based on who they are (like iOS users), while cohorts group them based on what they did and when. Mistaking one for the other can lead to wrong conclusions. Instead of grouping all iOS users, group those who installed the app during the same week and track how they behave over time.
- Using Too Broad a Time Window: Grouping users by month can hide valuable trends that appear week-to-week, especially during high-traffic times like sales. If you lump all March signups into one cohort, you might miss key behavior differences. Weekly (or even daily) cohorts offer more accurate signals.
- Tracking the Wrong Outcome: It’s easy to look at big-picture metrics too early. For example, tracking 90-day LTV for users who just signed up won’t tell you much. It’s better to track short-term behaviors first — like onboarding completion or first transaction — before jumping to long-term outcomes.
- Ignoring Cohort Decay Curves: A single retention or LTV number doesn’t reveal the full pattern. What matters is how those numbers trend over time. Looking only at Day 30 retention hides drop-offs that may have happened earlier. Plot the full curve to understand when users disengage and why.
- Not Comparing Cohorts Against Each Other: One cohort by itself gives limited insight. The real value comes when you compare multiple cohorts by week, source, or product to spot what changed. This helps you isolate the impact of campaigns, features, or even market shifts.
- Making Product Changes Without Closing the Loop: Teams often ship updates and assume they worked without checking behavior changes. If you don’t compare pre- and post-change cohorts, you can’t know if your product decision made a difference. Always close the loop by analyzing impact with the same cohort structure.
8. Conclusion
If your retention is dropping, don’t just check the average. Ask: Which customers dropped off? When did they join? What did they do?
That’s the power of cohorts — they help you go beyond numbers and understand real customer behavior. It’s not just about slicing data, it’s about seeing patterns in how people join, engage, and leave.
Whether you’re fixing onboarding, boosting repeat purchases, or improving campaigns, cohort-based insights help you act smarter and grow faster.
If you’d like to discuss how we can help enhance your customer retention and optimize your strategies, we’d be happy to set up a consultation call. Feel free to reach out to us at saurabh@daiom.in
For more informative content and blog, follow and stay tuned to DAiOM.
Subscribe to our NEWSLETTER!