Summary:
This blog explores the importance of digital analytics for businesses and provides a guide to understanding the various tools available. It highlights the ABC Model, which focuses on Acquisition, Behaviour, and Conversion, and explains the crucial differences between web and app analytics. It also provides an in-depth comparison of the top five digital analytics tools, including Google Analytics, Mixpanel, Adobe Analytics, Matomo, and Amplitude, outlining their key features, strengths, weaknesses, and pricing models. Finally, it emphasizes the need for businesses to select the most appropriate tool based on their specific needs and requirements to gain a competitive advantage in the rapidly evolving digital landscape.
1. Introduction
How do businesses harness 400 Million TB generated by 5 B people online spending 6 hrs / day across 3 Million app + 200 Million Websites.
Every website, app, and digital product needs to have a digital analytics measurement system. Imagine trying to steer a ship without a compass; that’s what running a business without digital analytics feels like.
Read more – Product Analytics: The Key to Growth and Retention
In today’s digital age, businesses cannot afford to operate blindly. Digital analytics provides the crucial insights needed to understand who your visitors are, what they do on your site, and how well they convert into customers.
It answers key questions such as:
- “What is my traffic?”
- “What is my conversion rate?”
- “Which marketing channels are driving the most engagement?”
- “Where are users dropping off in their journey?”
As a continuation of the MarTech blog series, let’s look at Digital Analytics, it’s benefits, and what tools are being used to make the most of its power and give people useful information.
"No great marketing decisions have ever been made on qualitative data.”
John Scully
2. The ABC Model
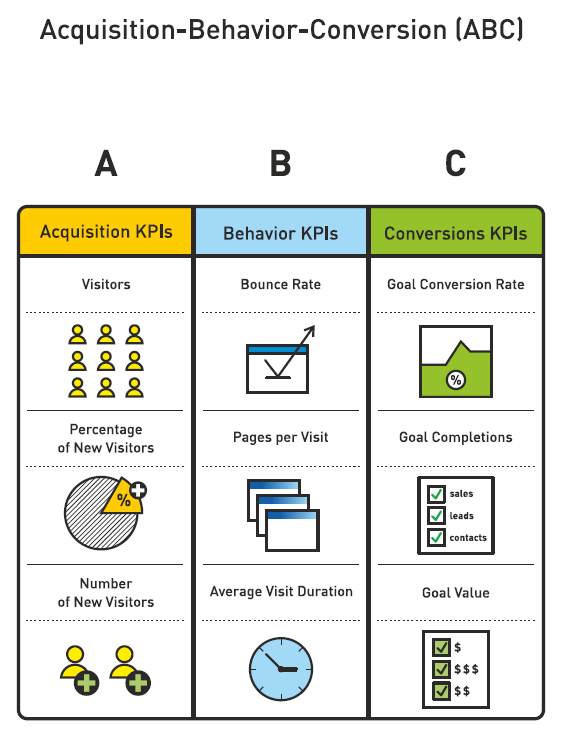
The ABC model—Acquisition, Behavior, and Conversion—serves as a cornerstone in digital analytics. The above infographic by intechnic shows the KPIs of the model.
- Acquisition helps you identify how visitors are arriving at your site, whether through search engines, social media, or direct visits.
- Behavior reveals what actions users take once they are on your platform, providing insights into popular pages, user interactions, and engagement levels.
- Conversion tracks how visitors transform into customers, showing which strategies are most effective in driving sales or achieving other business goals.
3. Web & App Analytics
While web analytics tools like Google Analytics track user activity on websites, app analytics provides deeper insights into mobile user behavior.
Furthermore, with about 50% of global web traffic coming from mobile, understanding how users interact with apps is crucial. Unlike websites that rely on page view data, apps offer event-based data, tracking specific actions like button clicks or document creation.
Moreover, mobile apps integrate with hardware like cameras and sensors, enabling richer user experiences. Traditional web analytics cannot capture this sophisticated behavior. To match this complexity, companies must invest in app analytics to track advanced actions and capabilities.
The below infographic gives us a detailed understanding of the differences between Web & App Analytics.

The Power of Together (A Unified View of the Customer Journey): Web analytics and app analytics don’t work in isolation. Furthermore, together, they paint a holistic picture of the customer journey. Imagine a user discovering your website, then downloading your app for a more interactive experience. By connecting these data points, you gain a deeper understanding of how users interact with your brand across different platforms.
4. Tools for Digital Analytics
Now that we understand the benefits of web & app analytics, let’s look at platforms that enable you to conduct such analysis. Furthermore, the G2 website has provided us with the grid representation of top Digital Analytics tools.
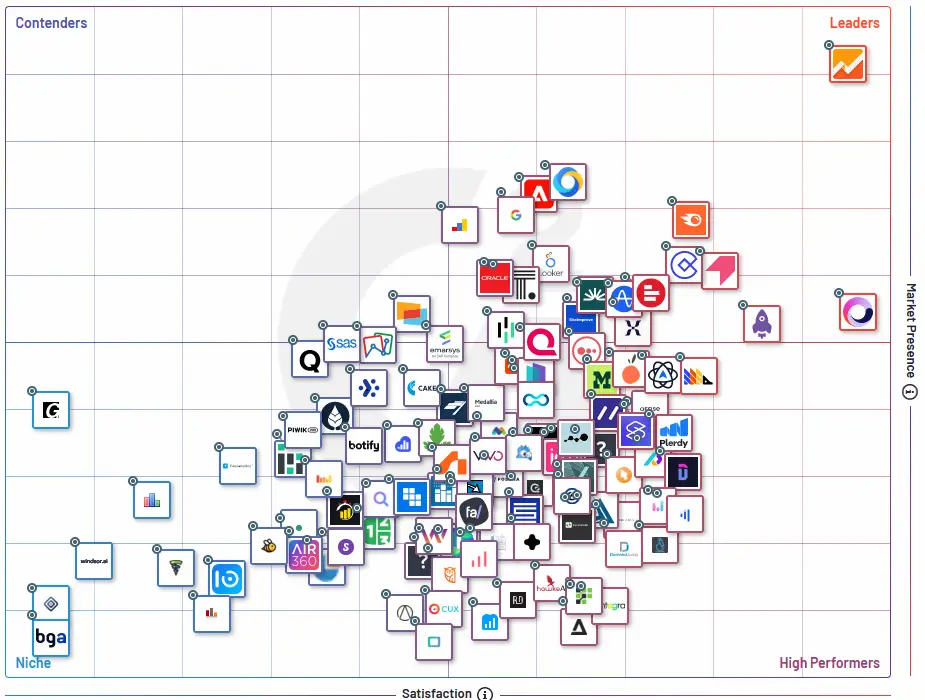
As you can see, the tool which is at the leader position with highest Market Presence and high performer is Google Analytics, with its competitors Adobe Analytics, MixPanel and Matomo are at the middle of the pack or at the edge of the pack. Furthermore, this depicts that Google Analytics is one of the most favoured tools among all the traditional digital analytics tools.
5. Top Tools Comparison
The below infographic shows the comparison of the top analytical tools used in the industry.
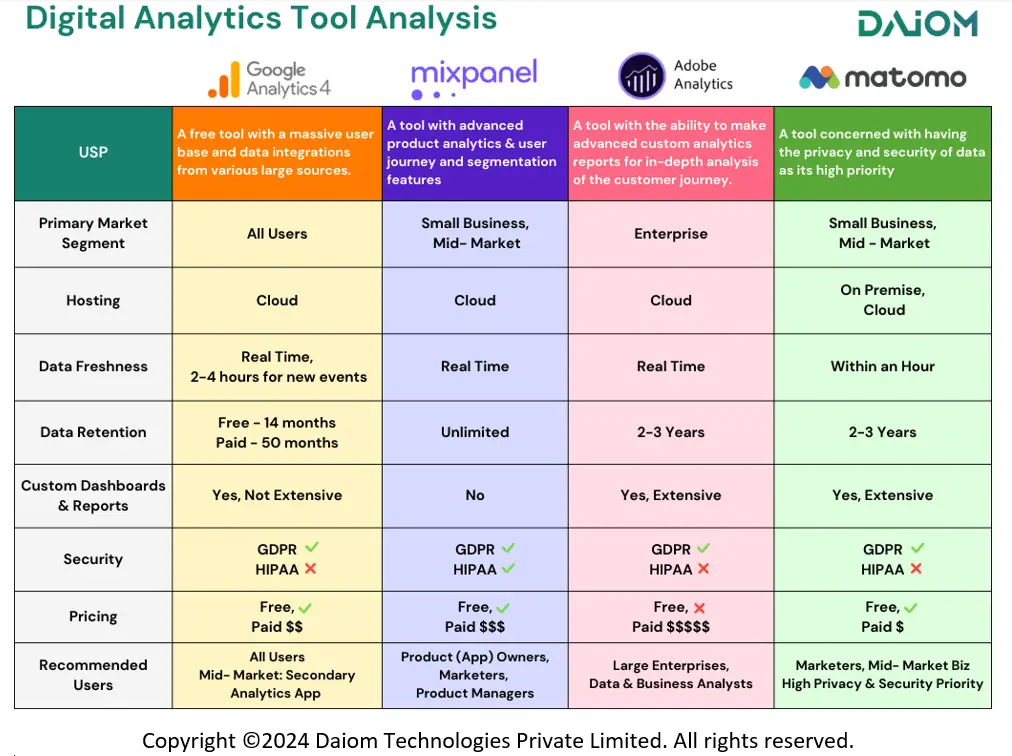
Insights:
- Google Analytics is highly integrated, widely used by all the small businesses, mid – markets and enterprises, and offers extensive customization and cloud support but lacks real-time data updates in newly added Events aspect and not the best in terms of security compliances.
- Mixpanel is strong in real-time data freshness, unlimited data retention, and security compliance but lacks some custom reporting and integration features.
- Adobe Analytics is robust in enterprise solutions with good support and integration but has slower data updates and higher pricing.
- Matomo is GDPR compliant, supports on-premise hosting, and is cost-effective for small businesses but has limited integration with BI tools and visualisation software.
6. Google Analytics 4
Google Analytics is a traditional web analytics tool providing quantitative user and customer data across devices and platforms. It boasts an unassailable market share of 89.62% in the analytics category according to the 6sense website.
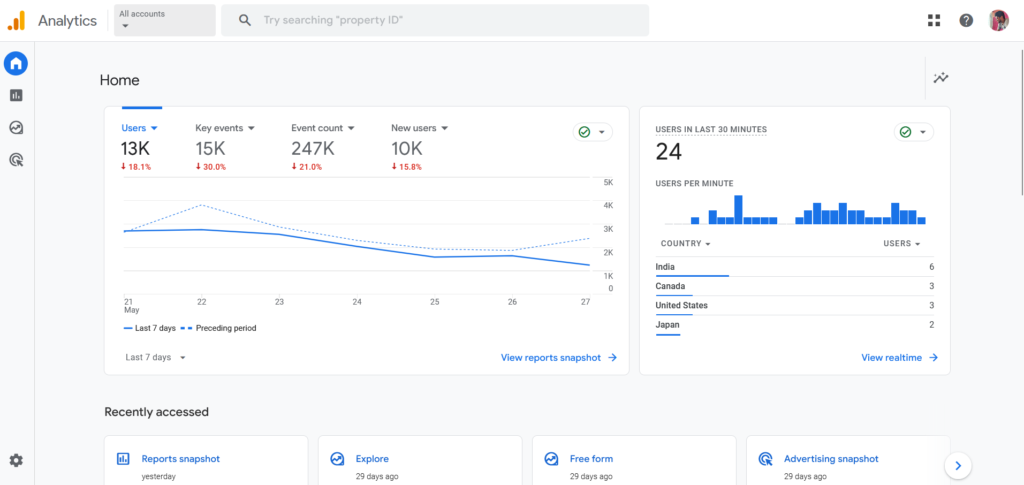
Google Analytics 4 (GA4) is the next generation of web analytics, offering a complete overhaul from its predecessor. It goes beyond simply tracking website traffic to provide in-depth customer behaviour analysis across platforms.
What to love about (USPs):
- Native Integration: GA4 seamlessly gets integrated with the other Google Marketing Platform (GMP) tools such as Google Ads, Search Console and Campaign Manager. You can see how website traffic from organic search (Search Console) translates into ad clicks (Google Ads) and ultimately website conversions (GA).
- Free and Freemium Options: GA offers a free tier with robust features, making it accessible to businesses of all sizes. This allows for easy integration with existing marketing tools without a significant upfront investment.
- BigQuery Integration: For advanced data analysis, GA4 integrates with Google BigQuery, a powerful data warehouse solution. This allows you to combine website data with other business data sets for deeper insights and custom reporting.
Features:
- Enhanced Dashboard: Enjoy a sleek interface with dedicated sections for reports, exploration, and configuration.
- Event-Based Tracking: Capture every user interaction (clicks, scrolls, purchases) for a detailed understanding of behavior.
- Cross-Platform Tracking: Unify website and app data to see the complete user journey across devices.
- Predictive Analytics: Forecast future user behavior like churn risk and purchase probability, enabling proactive marketing strategies.
- Advanced Metrics: Gain deeper insights with metrics like engagement rate and time spent on specific pages.
- Customization: Craft personalized dashboards, audience segments, and reports to focus on what matters most.
- Data Studio Integration: Transform data into impactful visualizations using Google Data Studio.
Pricing:
GA4 is a free service offered by Google. However, some advanced features and functionalities might be available in paid plans within the Google Analytics 360 which is an enterprise level product. It is said to priced around $150,000 per year for retail and could be priced up or down based upon the feature requirements.
What to watch out:
- Security Compliances: The safety compliances of the Google Analytics have always be a topic to be kept in mind. The GA4 doesnt comply to safety regulations like HIPAA & have to opt out some data to comply for GDPR.
- Data Freshness & Retention: The features may not be best in class for the free version but could overcome by opting for the paid version.
7. Mixpanel
Mixpanel stands out as a Product (App) Analytics powerhouse with it’s true strength lies in its primary focus on user behaviour & journey analytics. It has over 8000+ paying customers and it caters to various industries such as Consumer Tech, Media+Entertainment, Healthcare & Wellness and SaaS.
While Google Analytics 4 (GA4) offers a broader customer journey view, Mixpanel goes beyond the basics and reveals how users truly interact with your product or website.

What to love about (USPs):
Focus on User Behavior: Mixpanel excels at capturing and analyzing granular user behavior within your product or app. It goes beyond basic website traffic analysis, allowing you to understand how users interact with features, complete tasks, and navigate your product journey.
Features:
Mixpanel boasts a robust feature set specifically designed to empower you to understand your users:
- Event Tracking: Capture specific user actions within your platform, like button clicks, page views, or form submissions. This granular data paints a clear picture of how users interact with your product.
- User Segmentation: Group users based on shared characteristics or behaviour patterns. This allows you to tailor your analysis and identify specific user groups for targeted engagement strategies.
- Funnels: Visualise the steps users take to complete a desired action, like making a purchase or signing up for a free trial. Analyse drop-off points within the funnel and identify areas for improvement.
- A/B Testing: Test different variations of your product features or website elements (e.g., button colours, layouts) to see which version resonates better with users.
- Heatmaps: Visually see where users click and scroll on your web pages. This helps identify areas of user focus and potential areas for improvement in website design.
- In-App Notifications: Engage with users in real-time based on their behaviour. This allows you to personalise the user experience and drive desired actions.
Mixpanel empowers you to see your product or website through the eyes of your users. Furthermore, with this user-centric approach, you can create a more engaging and delightful experience, ultimately leading to a thriving business.
Pricing:
The Mixpanel is a freemium tool with all the essential features needed for gaining user behaviour insights available in the free version. The paid version start at $28 per month with advanced analytics and data pipeline features. The premium version could start as high as $833 per month with granular access and a facility to record over 1Billion + events per month.
What to watch out for:
- UI Complexity for Beginners: Mixpanel offers advanced analytics features which can be overwhelming for beginners. The initial setup and learning curve might be steep for users unfamiliar with event-based analytics platforms.
- Variable Pricing with Data Volume:Mixpanel’s pricing model can become expensive as your data needs grow, especially for small businesses or startups with limited budgets. The cost increases with higher data volume and additional features.
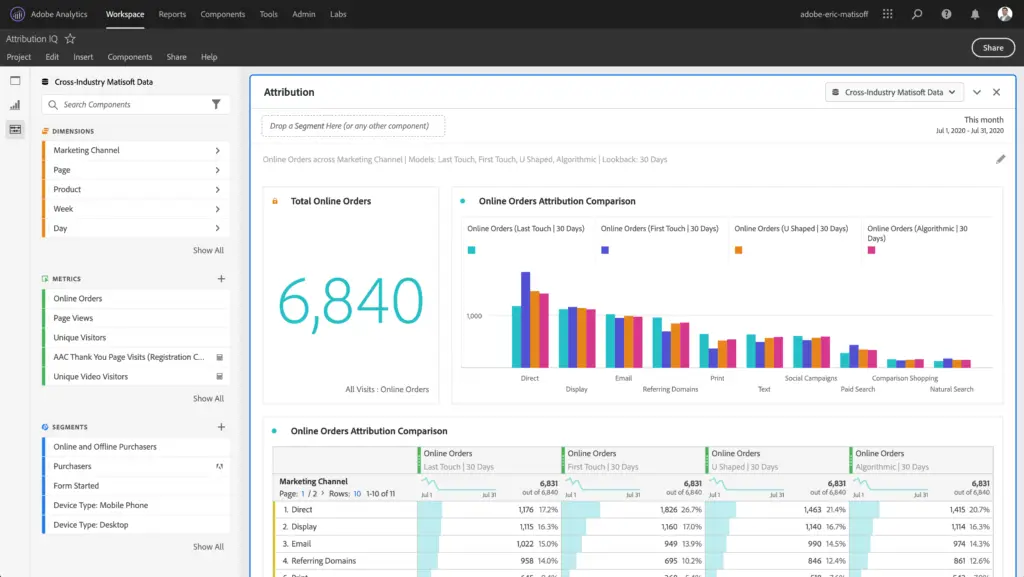
8. Adobe Analytics
Adobe Analytics is a powerful web analytics platform offered by Adobe as part of its Adobe Experience Cloud suite. It stands out as a premier solution, enabling organisations to delve deep into customer insights, personalise user experiences, and optimise ROI across marketing initiatives.
Adobe Analytics has a market share of 21.65% in the mobile-analytics market with over 1.21L users around the world.
What to love about (USPs):
- Actionable Customer Insights: Go beyond basic data. Gain deep customer understanding and tailor experiences for improved engagement and conversions.
- Unified Customer Journey: Break down data silos. Analyse online and offline interactions to see the complete customer journey across touchpoints.
- AI-Powered Optimization: Leverage advanced AI and statistical models for anomaly detection, predictive analytics, and proactive marketing strategies.
Features:
- Real-time Data Processing: React instantly to trends and customer behaviour with real-time data processing. Gain the agility needed in today’s fast-paced marketing landscape.
- Advanced Segmentation & Calculated Metrics: Craft hyper-targeted strategies by creating custom segments and calculated metrics for precise and actionable insights.
- Adobe Experience Cloud Integration: Enjoy a seamless platform for all your digital marketing needs. Integrate with other Adobe Experience Cloud tools for unified data analysis and decision-making.
- Multichannel Data Collection: Get a holistic view of customer behaviour. Collect data from all touchpoints – online, offline, mobile – for comprehensive analysis and campaign optimization.
- Advanced Reporting & Visualization: Make sense of your data with robust reporting and visualisation tools. Leverage them to identify trends, measure performance, and make informed decisions.
Pricing:
Adobe Analytics pricing is based on a custom quote system with it’s pricing could start as low as $2,500 per month and could easily spend over $100,00 per year. Furthermore, the cost depends on factors like data volume, features required, and enterprise size.
What to watch out for:
- Tailored for Large Enterprises: Adobe Analytics caters to large organisations with complex data needs.
- Learning Curve: The platform requires a higher level of data maturity to create custom reports and navigate the interface effectively.
9. Matomo
Matomo, formerly known as Piwik, carves its niche by prioritising user privacy and data ownership, empowering businesses to gain valuable insights while keeping user data secure. Today it’s used on over 1.4 million websites, in over 190 countries, and accessible in over 50 languages.

What to love about (USPs):
- Privacy-Centric Analytics: Gain valuable insights into user behaviour while prioritising user privacy and complying with data protection regulations.
- Self-Hosted Control: Maintain complete control over your data. You decide where it’s stored, who has access, and how it’s used.
- Highly Customizable: Tailor data collection and reporting to your specific needs, whether you’re an e-commerce store or a lead generation website.
Features:
- Real-time Tracking: Monitor website activity and user behaviour as it happens, allowing for immediate response and trend identification.
- Detailed Reporting: Gain in-depth insights into visitor demographics, traffic sources, conversions, and user journeys.
- Customizable Dashboards: Create personalised dashboards to track key metrics that matter most to your business goals.
- Heatmaps & Session Recordings: Visualise user navigation through heatmaps and session recordings. Identify areas for improvement in user experience and conversion optimization.
- Ecommerce Tracking (Premium): Track sales data, analyze customer behavior within your online store, and optimize the purchase funnel (available in paid plans).
- A/B Testing: Test different website elements to see what resonates best with users and drives higher conversions.
- Form Tracking: Analyze user interaction with website forms and identify areas for optimization.
- Multi-Site Tracking (Premium): Track data for multiple websites from a single platform, offering a centralized view of your online presence (available in paid plans).
Pricing:
Matomo offers a freemium pricing model. The basic features are free, while premium features like e-commerce tracking and multi-site tracking require paid plans which starts around $20 per month but price varies with the monthly traffic hits.
What to watch out for:
- Hosting and Maintenance: Matomo offers a self-hosted option which provides complete data ownership, but it requires technical expertise to set up and maintain the server infrastructure. This can be challenging for businesses without dedicated IT resources.
- Performance Issues: Self-hosted instances of Matomo can experience performance issues, especially with large datasets. Ensuring optimal performance may require additional server resources and fine-tuning.
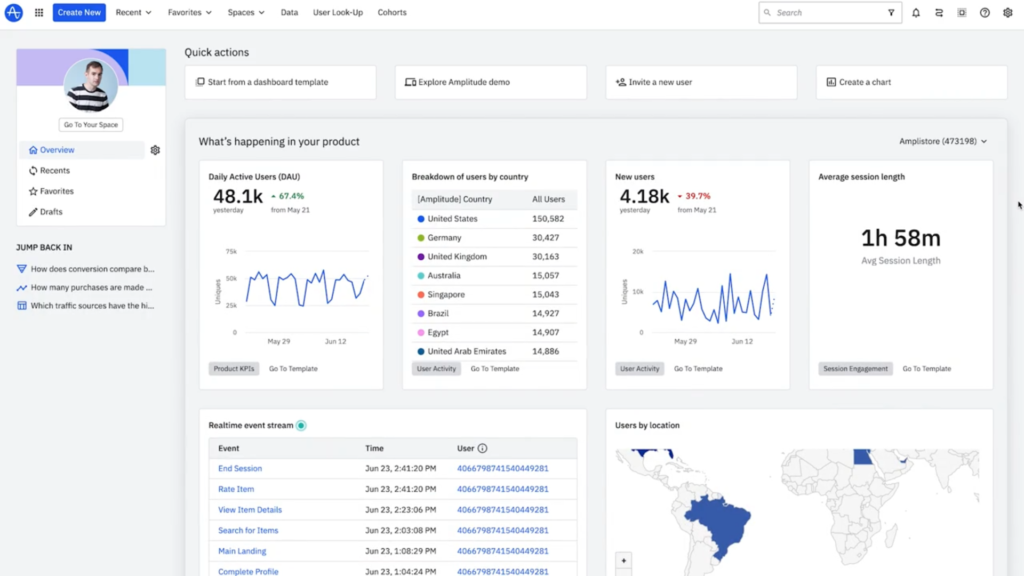
10. Amplitude
A special mention to be done for one of the top contenders of the digital analytics tool – Amplitude.
Amplitude has been one of the prominent players in the world of digital analytics, with an emphasis on product analytics which helps to access reliable product insights in seconds with automated reports and also understand the user journey at a glance with instant visualisations. Founded in 2012, it has been serving over 1200+ customers globally, notable ones such as Microsoft, Paypal, Atlassian. It has a modest 2.63% market share in mobile analytics platform as per 6sense.
What People Love About Amplitude:
- Deep Product Analytics: Amplitude excels in providing deep product analytics focused on user behavior and journey optimization. Amplitude’s real-time, event-based tracking, and advanced behavioral analytics capabilities allow for a more granular and actionable understanding of user interactions. (Read more – Product Analytics: The Key to Growth and Retention)
- Handling large amounts of Data: Amplitude’s strength lies in its ability to process and analyze vast amounts of data quickly, providing detailed insights into user behavior that help businesses iterate on their products rapidly.
- Ease of integration: Amplitude’s ease of integration with other product development tools makes it more adaptable for agile teams.
Features:
- Behavioral Analytics: Tracks and analyzes user actions to understand engagement and retention.
- Segmentation: Allows users to segment their audience based on various criteria for targeted analysis.
- Funnel Analysis: Visualizes the steps users take to achieve specific goals, helping to identify drop-off points.
- Cohort Analysis: Examines the behavior of grouped users over time to understand retention patterns.
- Real-Time Analytics: Provides instant insights into user behavior, enabling quick decision-making.
- Pathfinder: Visualizes the most common paths users take within a product.
- Experimentation: Integrates with A/B testing tools to measure the impact of changes on user behavior.
- Data Integrations: Connects with a wide range of data sources and tools for a comprehensive view.
Pricing:
Amplitude is a freemium tool with 3 tiers of pricing. Starter, Plus & Growth
- Starter – It is free version, which caters the individuals, explorers and early startups.
- Plus – It is for the mid – market businesses who are on tight budget but want an upper hand on their competitors in product analytics. The pricing starts from $49 per month.
- Growth – It is the enterprise tier of the subscription for companies who are in a steady growth phase and want to leverage the power of analytics and get a foothold on the market. It is custom priced but it could start as high as $1000 per month.
What People Have to Look Out For:
- Complexity for Beginners: The vast variety of features can be overwhelming for new users without proper training or onboarding.
- Data Privacy: Handling of sensitive data requires strict adherence to privacy regulations and best practices.
- Cost: Pricing can be high for smaller businesses or startups with limited budgets.
11. Conclusion
In this fast changing Omni-Channel world with recent advancements in Big Data & AI, it has become almost a necessity for businesses and marketers to use the tools available in front of them.
And the tools which are selected are not to be done on the basis of which one’s the most premium or the advanced one, it has to be done on the basis of their business requirements and needs. So, choosing the right tool for the appropriate business need would make the business have a competitive advantage for the competitors and help in thriving in the industry.
We hope that this blog has helped you to gain a better understanding of the digital analytics world and its offerings, so that you could make an informed decision for your business needs.
Disclaimer – This blog reflects our experience of working with multiple tools over the past decade.
Stay tuned for more such informative blogs.
Subscribe to our Newsletter!