Today, there are over 2.1 million apps out there, and the average person has around 100 apps on their phone. For every category, they usually use 5–6 apps, which means it’s tough for any app to grab and keep their attention. This is where digital analytics helps—it shows businesses what users want, how they behave, and how to keep them coming back
Winning in this competitive landscape isn’t just about launching an app. It’s about constantly iterating, improving, and ensuring your product aligns with user needs.
With over 550,000 apps on the Google Play Store competing for attention, to stand out in this competitive market, you need to help users get what they want—whether it’s buying your product, enjoying your podcast, or something else.
To truly understand what your users want and how they interact with your product, embracing analytics is essential. It helps you learn more about their behavior and improve your app in the right way. This approach falls under the broader domain of digital analytics, a powerful tool to decode customer behavior and drive impactful decisions.
Read more – Digital Analytics: An Ultimate Tool Guide
Earlier, physical stores were the main connection between businesses and customers. Now, digital products serve this role, shaping user experience and brand perception.
Digital products have become the main way brands connect with customers. A well-designed product can build trust, keep users engaged, and drive business growth.
But how do you know if your product is truly meeting users’ needs?
This is where product analytics comes in.
A well-designed product builds trust and loyalty, driving growth, acting as a platform for value exchange, where brands provide features or services, and users respond with payments or data.
In fact, the global product analytics market was valued at $7.86 billion in 2023, and is expected to grow at a compound annual growth rate (CAGR) of 14.6% from 2023 to 2032.
To succeed, brands must focus on attracting, engaging, and retaining users.
This blog will explore why product analytics is so important, how it can optimize user experiences, and why it’s essential for brand’s success.
You don’t need to learn what customers say they want; you need to learn how customers behave and what they need. In other words, focus on their problem, not their suggested solution.
Cindy Alvarez, Principal Group Product Manager at Microsoft and Author
Table of Contents
- Why is Product Analytics Gaining Momentum?
- Why Digital Analytics is Key to Product Success?
- 10 Product KPIs Every Company Should Focus On
- B2B Vs. B2C: Understanding the Sales Journey
- Retaining Users: The Key to Sustainable Growth
- Funnel Analysis: A Key to Optimizing User Journeys
- Cohort Analysis
- Conclusion
1. Why is Product Analytics Gaining Momentum?
Product analytics is growing rapidly because it plays a crucial role in driving growth and enhancing user experiences. It helps businesses understand how users interact with their products, leading to better decision-making.
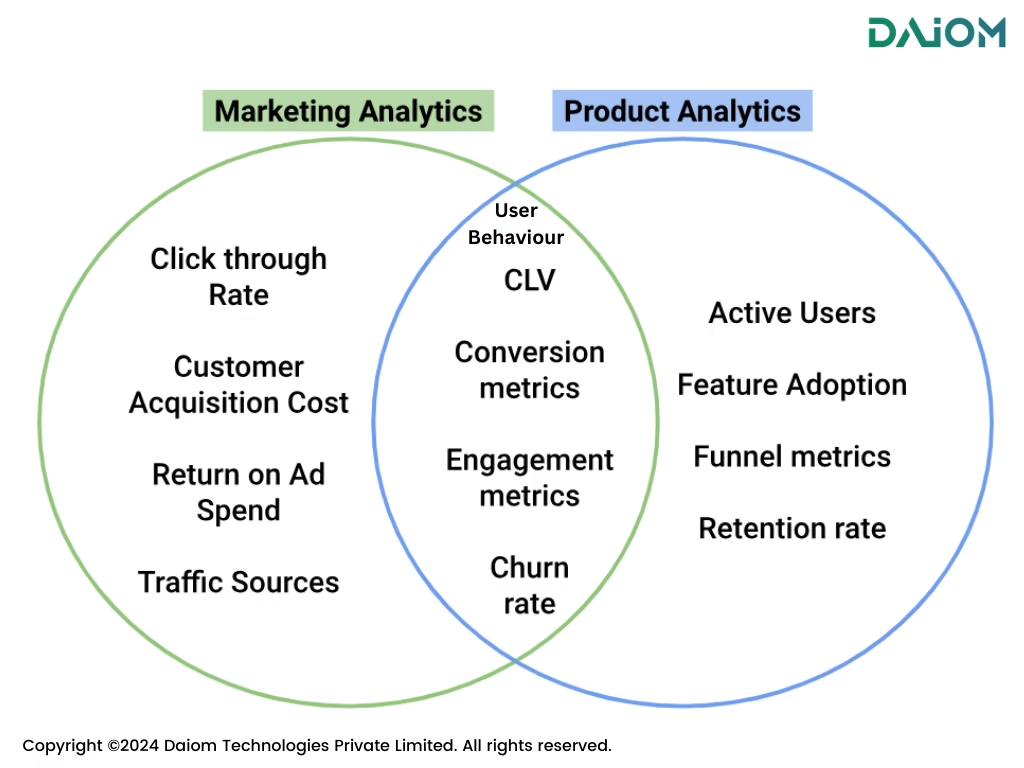
There is a natural overlap between marketing analytics and product analytics, as both focus on using data to improve performance. However, product analytics takes a more targeted approach by specifically tracking user behavior within a product. This overlap enables businesses to fine-tune their digital strategies and create more seamless, engaging experiences for users.
The number of mobile apps is projected to reach over 1.1 million on the Apple Store and 1.5 million on the Google Play Store by 2025. Moreover, 71% of users abandon apps after one use. This highlights the need for brands to understand why users drop off early and how to improve retention.
Instead of just counting clicks or sign-ups, product analytics uncovers the “why” behind user behavior. It reveals how users interact with your product, where they face challenges, and what truly adds value to them.
By digging deeper into this data, brands can make smarter decisions, enhance the user experience, and improve retention.
Without these insights, brands risk wasting valuable time and resources on features or strategies that don’t connect with users, potentially missing opportunities for growth. With proper product analytics, brands can answer key questions such as:
- Which features do users value most?
- Where do they encounter friction?
- How can you enhance retention and drive growth?
As the digital landscape becomes more competitive, product analytics helps businesses make informed decisions, prioritize investments, and align their products with broader business goals. It’s a critical tool for ensuring that products deliver real value to both users and brands, leading to long-term success.
2. Why Digital Analytics is Key to Product Success?
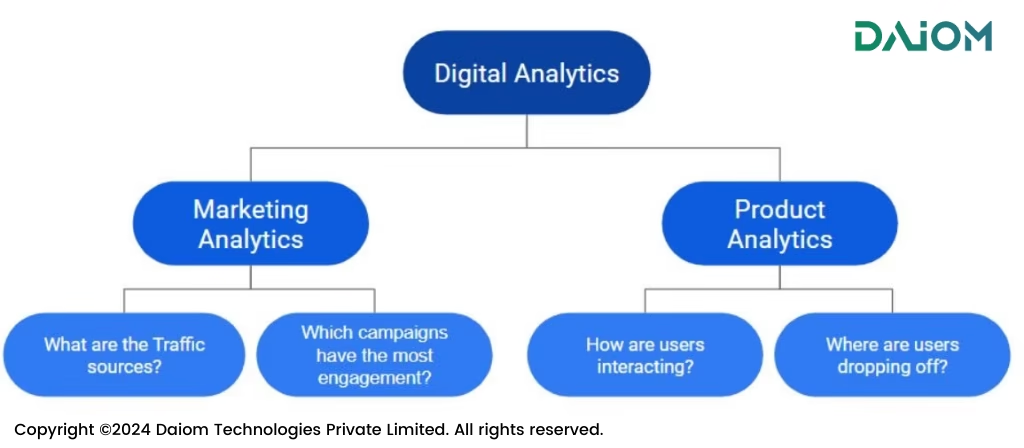
Digital analytics is crucial for making smart decisions about how to attract, engage, and keep customers. It includes two main areas: marketing analytics and product analytics, with the latter being an important part of the bigger digital analytics picture.
Read More – Digital Analytics: An Ultimate Tool Guide
In the ABC framework, Product Analytics helps in understanding the B (Behavior) of customers. Whereas, Marketing Analytics focuses on A (Acquisition).

2.1 Marketing Analytics
Marketing analytics helps brands understand how to bring people to their product. It answers questions like:
- Where are users coming from? Which platforms or channels are driving traffic?
- Which campaigns work best? What’s getting the most clicks or engagement?
- Which channels give the best results for the money spent?
This helps businesses focus on strategies that work and avoid wasting resources.
Read more – Marketing Analytics | The Next Big Frontier in Data-Driven Growth
2.2 Product Analytics
Product analytics, a subset of digital analytics, looks at how people use the product and helps improve their experience. It focuses on questions like:
- Are users completing important actions? Are they doing what you want them to do, like signing up or making a purchase?
- Which features do users love the most? This helps improve and prioritize those areas.
- Where are users getting stuck or leaving? Identifying these points helps fix problems and keep users happy.
Marketing and product analytics give a complete view of the customer journey. They help brands attract more users, keep them engaged, and build long-term success.
3. 10 Product KPIs Every Company Should Focus On
KPI | Why is it Important? |
Customer Retention Rate | Measures customer loyalty and long-term business health. Higher retention reduces acquisition costs. |
Net Promoter Score (NPS) | Gauges customer satisfaction and likelihood of referrals. High NPS predicts growth. |
Monthly Active Users (MAU) | Reflects product engagement and popularity. Growing MAU suggests increasing relevance. |
Customer Lifetime Value (CLV) | Estimates the total revenue a customer generates. Guides marketing and acquisition budget decisions. |
Churn Rate | Indicates the percentage of customers leaving. Helps identify retention issues. |
Average Revenue Per User (ARPU) | Shows revenue per customer. Useful for benchmarking and revenue optimization. |
Conversion Rate | Measures efficiency of turning users into paying customers or desired outcomes. |
Feature Adoption Rate | Tracks the success of feature rollouts and user adoption of new capabilities. |
Time to Value (TTV) | Assesses how quickly users derive value from the product. Short TTV improves satisfaction and retention. |
Customer Support Ticket Trends | Identifies issues affecting user experience. Helps prioritize product or process improvements. |
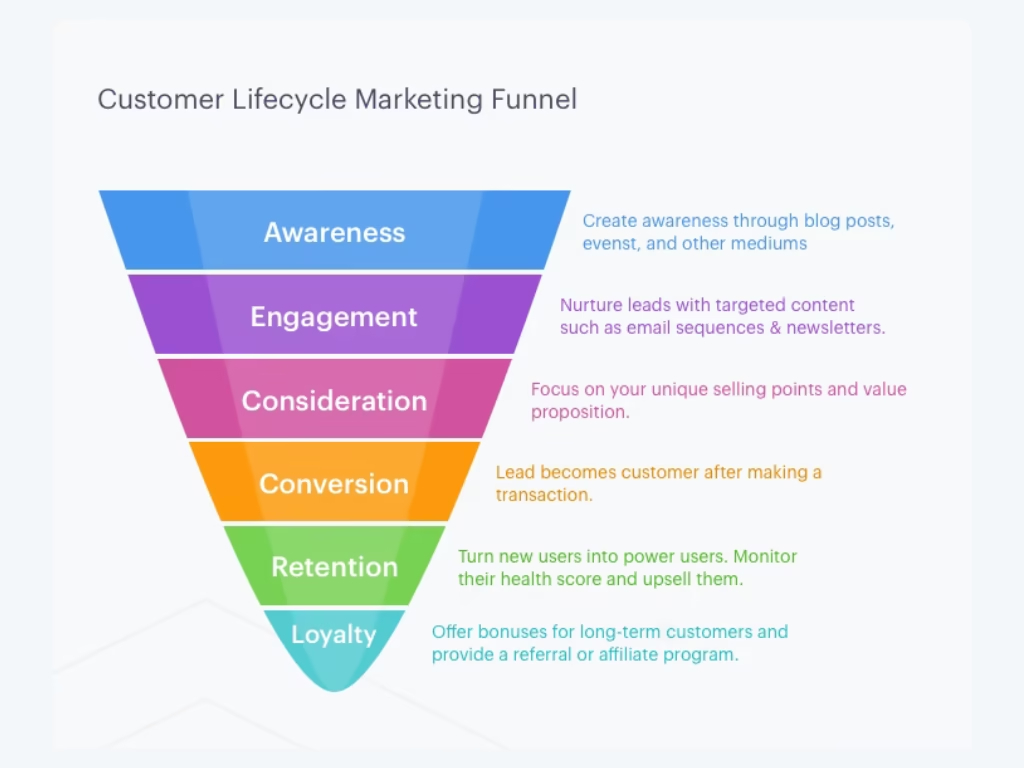
Step 1: Getting Traffic
To make a product successful, the first step is attracting visitors.
But not all traffic is equal—it’s important to know where it’s coming from and how useful it is.
Sources of Traffic
Traffic Source | Description |
Organic Traffic | Users discover products through search engines or content like blogs, arriving with specific intent. |
Direct Traffic | Visitors who enter your URL directly, often familiar with your brand, indicating strong brand loyalty. |
Paid Campaigns | Traffic from paid ads on platforms like Google and Facebook, requiring precise targeting for quality. |
Social Media | Traffic generated through organic posts or paid promotions on platforms like Instagram and LinkedIn, relying on visual appeal and viral potential. |
Referral Traffic | Users coming from partner websites or backlinks, typically trust-based and often converting well. |
Retention Marketing | Traffic from newsletters or promotional emails, bringing users with a higher intent to engage or convert. |
Traffic Quality Check
- Engagement Rates: How active users are.
- Conversion Rates: How many complete an action, like signing up or buying.
Step 2: App Installation
After driving traffic to your product, the next key step is getting users to install the app. An installation indicates a shift from interest to potential engagement.
Track these important metrics: App Install Rate, App Uninstall Rate, and Retention Metrics, and link installs to traffic sources for better insights.
Key Metrics:
- Install Rate: How many visitors download the app. A low rate might mean unclear benefits or poor reviews.
- Uninstall Rate: High uninstall rates may mean the app isn’t helpful or user-friendly.
- Retention Metrics: Track how many users stick around after Day 1 or Day 30.
Step 3: The Login Journey
The Login journey is crucial as it’s the first real interaction between a user and an app. It provides an opportunity to gather valuable first-party data like email addresses or phone numbers, enabling personalized experiences and building long-term relationships.
Sign Up Method | Why do users like it? | What to Watch Out for? |
Mobile OTP | Quick and Familiar | OTP delivery time and rate, |
Email Verification | Prefer sharing Email over Phone number | OTP delivery time |
Google Sign-In | Trusted and simplified one-click login | Transparency about permissions being granted |
KPIs to assess performance
- Conversion Rate of Sign-Ups/Login Attempts
- Time to Complete Login/Sign-Up
- Abandonment Rate
Step 4: Core Product Usage
After logging into the app, the customer begins using the product, and this is where the true value of your offering must come to life. The ultimate goal of the product is to help the customer realize value with minimal effort or friction.
Whether it’s streaming content on Netflix or purchasing items on Amazon, the product’s success hinges on how easily and effectively users can achieve their goals.
Key Metrics to Track:
- Time to Value: How fast users achieve their goal, like streaming or shopping.
- Conversion to Value: How many users actually achieve their goal.
- Drop-Off Rates: Where users quit before completing their task.
Step 5: User Journeys – Top 10 Journeys You Should Focus On
Here are the most important user journeys:
|
Customer Journey |
What is its Importance? |
|
New User Onboarding |
Ensures users quickly understand and see the value of your product, increasing retention and engagement. |
|
Login and Authentication |
Simplifies access while ensuring security, building trust and reducing user friction. |
|
Search and Discovery |
Helps users find what they need quickly, enhancing satisfaction and engagement. |
|
Purchase or Subscription |
Streamlines transactions, boosts trust, and increases conversions with a hassle-free checkout. |
|
Customer Support and Issue Resolution |
Resolves user problems efficiently, improving loyalty and overall experience. |
|
Returns, Refunds, or Cancellation |
Turns potential negative experiences into trust-building opportunities through simplicity and fairness. |
|
Profile and Account Management |
Empowers users to control their preferences easily, improving satisfaction and convenience. |
|
Feedback and Reviews |
Shows users their input matters, fostering trust and continuous product improvement. |
|
Engagement and Re-engagement Journeys |
Revives inactive users with personalized strategies, sustaining long-term engagement. |
|
Cross-Platform or Cross-Device Usage |
Provides a seamless experience across devices, reinforcing product reliability and usability. |
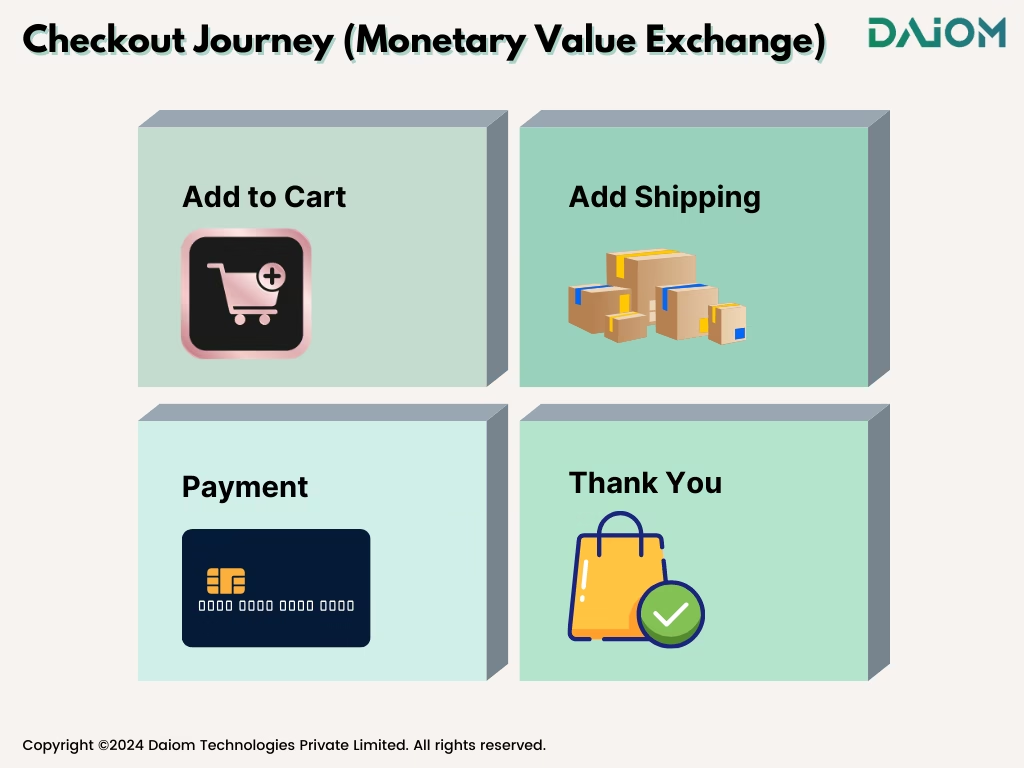
Step 6: Checkout Journey (Monetary Value Exchange)
The checkout journey is where customers commit their money through purchases or subscriptions, making it a vital step in the value exchange.
A well-designed checkout process boosts conversions, enhances satisfaction, and builds loyalty. In contrast, a confusing or clunky checkout can lead to cart abandonment and lost revenue.
- Reduce Friction: Minimize unnecessary steps and allow guest checkouts to avoid forcing account creation.
- Abandoned Cart Recovery: Use email or SMS reminders to re-engage users who didn’t complete the checkout process.
- Localization: Adapt currency, language, and shipping options based on the user’s location for a more personalized experience.
- Upselling and Cross-Selling: Subtly suggest complementary products during checkout to increase cart value without being intrusive.
- Accessibility: Ensure the checkout flow is user-friendly across all devices and inclusive of assistive technologies.
Step 7: Collecting and Understanding Feedback
Feedback is the voice of your customers—it’s how they tell you what’s working, what’s not, and what they want from your product. Collecting feedback at various stages of the user journey and in different forms is essential for understanding their needs and continuously improving your product. When done right, feedback becomes a roadmap for innovation and higher customer satisfaction.
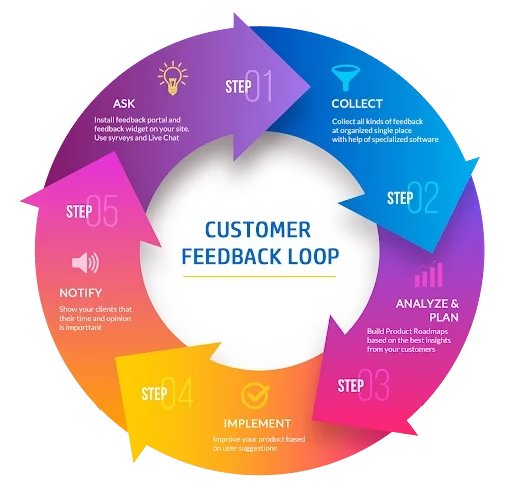
Key Feedback Types to Collect
- User Reviews and Ratings
Provide an overall sense of how users feel about your product. Ratings offer a quick snapshot, while reviews give deeper insights into specific strengths and pain points. - Net Promoter Score (NPS)
NPS measures the likelihood of your users recommending your product to others. It’s a direct indicator of customer loyalty and satisfaction. - Customer Satisfaction Score (CSAT)
CSAT captures how satisfied customers are with a particular experience, such as resolving an issue or using a specific feature.
Feedback can be collected via these – In-App Surveys, Post-Support Interactions,.Email Requests, Social Media Listening and Usability Testing
Analyzing Feedback
- Identify recurring issues or praise points.
- Segment Feedback by User Type
- Prioritize Improvements basis Feedback
4. B2B Vs. B2C: Understanding the Sales Journey
Understanding the key differences in B2B and B2C sales journeys is crucial for tailoring your approach and optimizing conversion strategies. Here’s a breakdown of each model:
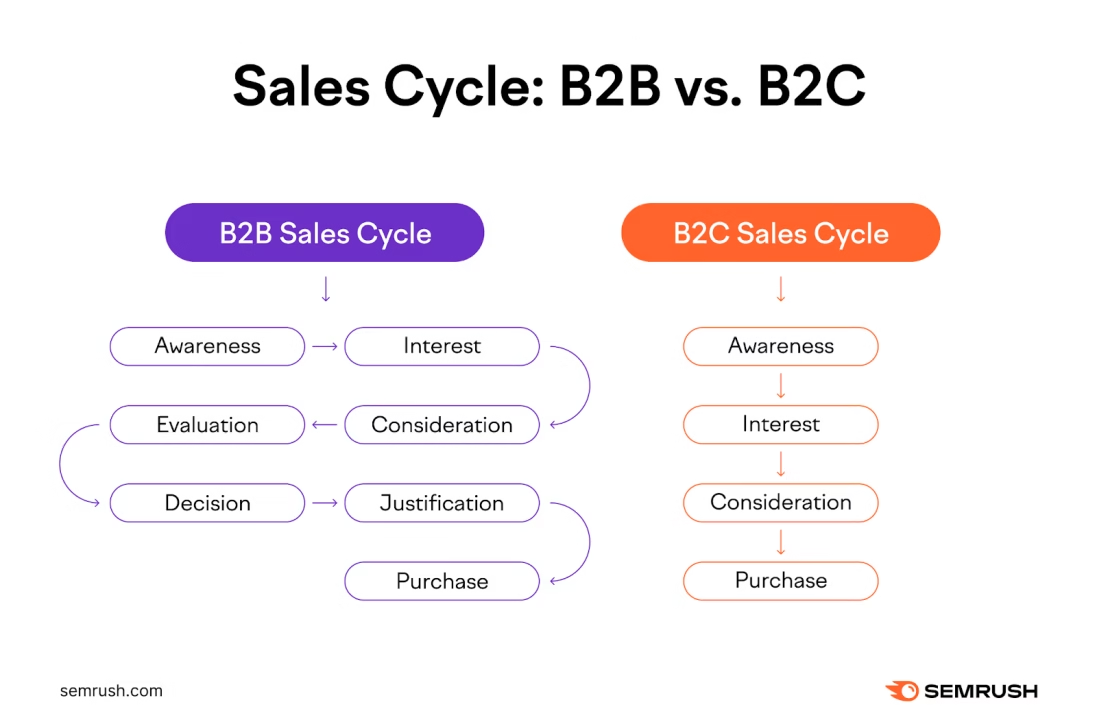
B2B Sales
- The focus is on generating leads through forms, demo requests, or content downloads.
- The sales process involves personalized engagement, trust-building, and longer cycles.
- Buyers prioritize ROI and tailored solutions.
- Key metrics include lead-to-deal conversion rates, time to close, and lead quality.
B2C Sales
- The goal is to provide a seamless self-checkout experience for quick purchases.
- The journey is low-touch, relying on intuitive design, offers, and convenience.
- Buyers value speed and ease, often making impulse decisions.
- Important metrics are conversion rates, average order value, and cart abandonment rates.
Assisted Self-Checkout
- This hybrid approach works for high-ticket purchases like luxury goods.
- It blends self-service with human assistance to guide and reassure customers.
- Metrics to watch include assisted conversion rates, customer satisfaction, and response time.
5. Retaining Users: The Key to Sustainable Growth
User retention means keeping your customers happy and coming back to use your product. It’s more than just stopping them from leaving—it’s about creating strong relationships where they see value in your product and stay loyal, even when competitors try to attract them.
Why Does Retention Matter?
- Cost-Effective: Acquiring new customers is expensive—retaining existing ones costs far less and boosts lifetime value.
- Revenue Becomes Predictable: Loyal users provide stable income, which is crucial for growth.
- Drives Advocacy: Happy users are your best marketers, spreading the word and bringing in referrals.
- Enhances Improvement: Feedback from retained users helps brands refine and optimize their product.
Key Metrics to Watch:
- Retention Rate & Churn Rate: Show how many users stay or leave over time.
- DAU/MAU Ratio: Indicates how often monthly active users engage daily.
- Customer Lifetime Value (CLTV): Measures long-term revenue per customer.
- Net Promoter Score (NPS): Tracks user loyalty and their willingness to recommend you.
Product Strategies to Improve Retention:
- Nail Onboarding: First impressions count—make sure your onboarding process is smooth and value-packed.
- Show Value Fast: Help users discover the “aha moment” early on to hook them.
- Personalize Experiences: Use data to tailor the product to individual user needs.
- Encourage Exploration: Guide users to try more features, expanding their use of the product.
- Offer Proactive Support: Address potential issues before they escalate.
- Keep It Fresh: Roll out meaningful updates that align with user needs and communicate them well.
6. What is Funnel Analysis?
A funnel shows the steps users take to reach a goal, like signing up or buying something. It maps the user journey, highlights where users drop off, and helps find areas to improve.
Why Is Funnel Analysis Important?
- Spot Drop-Offs: Pinpoint stages with the highest user attrition.
- Understand What Works: Identify successful steps to replicate across the product.
- Segment Insights: Analyze behavior for different user groups, like new vs. returning users.
- Find Optimization Opportunities: Focus on areas with the most impact on user flow.
Using Funnel Analysis to Improve Customer Journeys
- End-to-End Visibility: Map the full journey from entry to goal, ensuring alignment with user needs.
- Reduce Friction: Address confusing or clunky steps causing drop-offs.
- Streamline Paths: Remove unnecessary steps to simplify user actions.
- Re-Engage Users: Target drop-off points with reactivation efforts like reminders or offers.
Leveraging Funnels for Product Improvement
- Measure Features: Assess if new features improve user progression.
- A/B Test Changes: Compare variations to ensure changes positively affect flow.
- Prioritize Development: Focus efforts on fixing critical drop-offs for maximum ROI.
- Track Adoption: Use funnels to gauge how well users adopt and engage with new features.
7. What is Cohort Analysis?
Cohort analysis groups users with similar traits or experiences over time. It helps businesses discover behavior patterns, improve retention, and make better product decisions.
Read more – Cohort Vs. Segment: Are Brands Using These Terms Correctly?
Cohort vs. Segment
- Cohort: Focuses on groups formed by shared time-based or behavioral events.
- Segment: Divides users by broader, often static attributes like demographics or geography.
Why Cohort Analysis Matters:
- Understand Journeys: Track how cohorts progress and identify opportunities to enhance user experiences.
- Monitor Retention: Spot where engagement drops off to guide improvements.
- Behavioral Insights: Learn what drives or hinders specific user behaviors.
Types of Cohorts:
- Time-Based: Users grouped by signup or interaction date.
- Behavioral: Based on actions like purchases or feature usage.
- Funnel-Based: Aligned with stages of the sales funnel, such as cart abandoners.
Key Metrics to Track:
- Retention Rate: Who sticks around over time.
- Engagement: Usage frequency and feature adoption.
- Conversion Rate: Actions completed, like purchases.
- Customer Lifetime Value (CLV): Total revenue from a user.
- Churn Rate: Users who stop engaging.
Driving Product Growth with Cohort Analysis:
- Reduce Churn: Use retention data to pinpoint and address drop-offs with strategies like better onboarding or targeted outreach.
- Optimize Acquisition: Compare cohorts by acquisition channel to focus on high-performing sources.
- Improve Experience: Observe feature usage trends within cohorts to refine product design and prioritize popular functionalities.
A great product not only builds trust but also drives growth by meeting user needs effectively.
8. Conclusion
Today, products have become the main way for brands to connect with users. To truly understand what users want and improve their experience, brands need product analytics. It’s not just about tracking numbers like clicks or sign-ups; it’s about finding out why users act the way they do and where they face problems.
Using these insights, brands can make smart decisions, improve features, and keep users happy. This leads to better user experiences, stronger retention, and long-term growth. Investing in product analytics means you’re not just guessing—you’re building a product that users love and trust.
If you’d like to discuss how we can help enhance your customer retention and optimize your strategies, we’d be happy to set up a consultation call. Feel free to reach out to us at alibha@daiom.in
For more informative content and blog, follow and stay tuned to DAiOM.
Subscribe to our NEWSLETTER!


